When To Buy Or Sell Residential Property? A Data-Driven Investigation
Key Findings
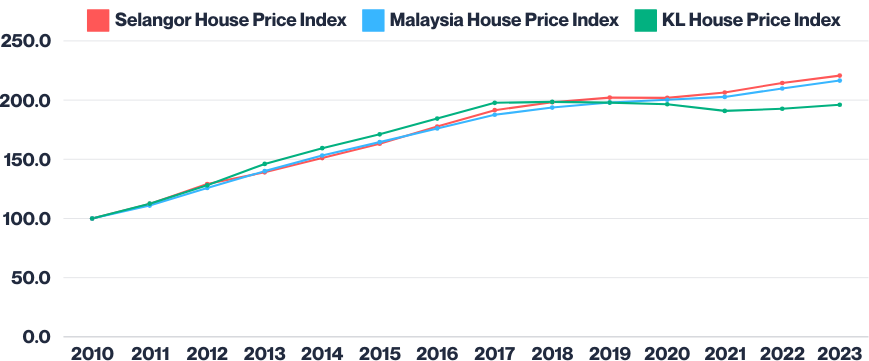
- The House Price Index (HPI) Reflects the Long-Term Trend: residential property values tend to rise over time, but it lacks the insight needed for short-term buying or selling decisions. See Chart 1.
- Year-on-Year (YoY) Change Reveals Market Dynamics: By analysing the YoY change in the HPI, we can uncover short-term trends in market demand. A downward trend points to a buyer’s market (low demand or high supply), while an upward trend signals a seller’s market (high demand or low supply).
- Transaction Volume Data Confirms Market Cycles: Selangor & KL transaction volumes follow the same pattern as the HPI YoY change, validating that these shifts indicate cyclical trends in buyer and seller power.

Market Activity Overview: Malaysia HPI YOY Change
Chart 2 illustrates the YoY change in the HPI across all residential property types in Malaysia. From 2010 to 2012, there was an upward trend, indicating strong demand in the residential property market (seller’s market).
However, after 2012, the graph trends downward, which may seem contradictory compared to the actual HPI, which continues to rise. This divergence suggests that while the HPI itself is still increasing, the declining YoY change indicates reduced demand, potentially signaling market equilibrium or the beginning of a buyer’s market. Factors such as market saturation (supply matching demand), economic conditions (like inflation or rising living costs), regulatory changes (such as tax reforms or stricter lending criteria), and global economic influences may contribute to this decline. In such scenarios, buyers may find more opportunities and leverage in negotiations (buyer’s market).
.png)
.png)
Market Activity Overview: KL and Selangor HPI YoY Change
Chart 3 focuses on the HPI YoY change for Kuala Lumpur (green) and Selangor (red). As expected, both regions mirror the overall Malaysia HPI YoY change; however, the trends for Kuala Lumpur and Selangor are less smooth. This is primarily due to the fact that the national graph includes data from all states, which dampens fluctuations and creates a smoothing effect.
.png)
.png)
Market Activity Overview: Total Transactions - KL and Selangor
Finally, Chart 4 presents the total residential transaction volumes for Selangor and Kuala Lumpur from 2010 to 2023. The transaction volumes closely follow the patterns established in Chart 2 and Chart 3, reinforcing the hypothesis that HPI YoY trends and transaction volumes provide valuable insights into market dynamics and can help identify the optimal timing for buying or selling residential property.
.png)
.png)
Data Source
- https://napic2.jpph.gov.my/en
Disclaimer
This document, created by City Valuers & Consultants, is intended for general informational purposes only and does not establish any advisory, fiduciary, or professional relationship. While based on established methods, it is not a definitive forecast, appraisal, or valuation, and we make no warranties or representations as to the data's current accuracy or completeness. The data presented includes third-party information, which could contain inaccuracies or be outdated, and has not been independently verified. We disclaim liability for any errors, omissions, or inaccuracies and any loss or damage arising from reliance on this information.