Real Estate Market Insights for Gombak District
Gombak District - Top 10 Transacted Locations (2010 to 2023)

- Bandar Tasik Puteri - 3830
- Bandar Country Homes - 3123
- Desa Aman Puri - 2351
- Ukay Perdana - 2264
- Taman Sri Gombak - 1807
- Wangsa Permai - 1392
- Kota Emerald - 1332
- Taman Bukit Indah - 1326
- Taman Melawati - 977
- Taman Bukit Idaman - 893
Investment Analysis by Property Type (2010–2023)
This section breaks down key investment metrics across residential property types in the Gombak District. We analyze transaction volumes, median prices, and growth trends to provide a clear view of market performance over the years.
| Metric | Terrace | Apartment | Condo & Serv Apt | Detached | Semi-D | Townhouse |
|---|---|---|---|---|---|---|
| Transaction Volume (2010 - 2023) | 26267 (41.61%) | 18327 (29.03%) | 7246 (11.48%) | 6511 (10.31%) | 3023 (4.79%) | 1758 (2.78%) |
| Total Transaction Value | 2010: RM 617.3 mil 2023: RM 1.018 bil |
2010: RM 126.8 mil 2023: RM 213.7 mil |
2010: RM 116.8 mil 2023: RM 162.2 mil |
2010: RM 534.2 mil 2023: RM 418.5 mil |
2010: RM 222.6 mil 2023: RM 249.9 mil |
2010: RM 28.9 mil 2023: RM 15.8 mil |
| Median Price (2023) | RM 527 k | RM 210 k | RM 370 k | RM 550 k | RM 930 k | RM 310 k |
| CAGR (2010 - 2023) | 5.71 % | 4.27 % | 4.13 % | 5.79 % | 1.28 % | 3.37 % |
- Table information based on selective NAPIC data
- CAGR is the Compounded Annual Growth Rate
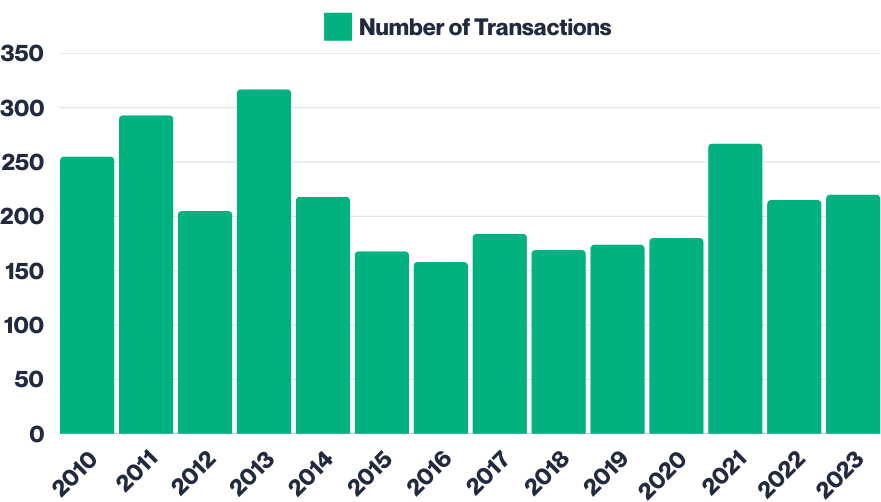
Number of Transactions - Terrace
- Total Transactions (2010 - 2023): 26267
- Average Transactions Per Year: 1876
- Year with Lowest Transactions: 2017 (1406 transactions)
- Year with Highest Transactions: 2021 (2838 transactions)
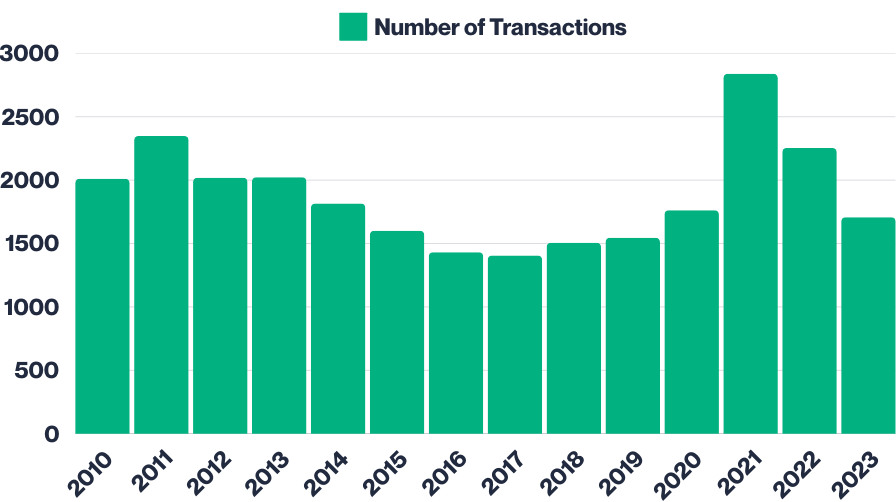
Graph based on selective NAPIC data
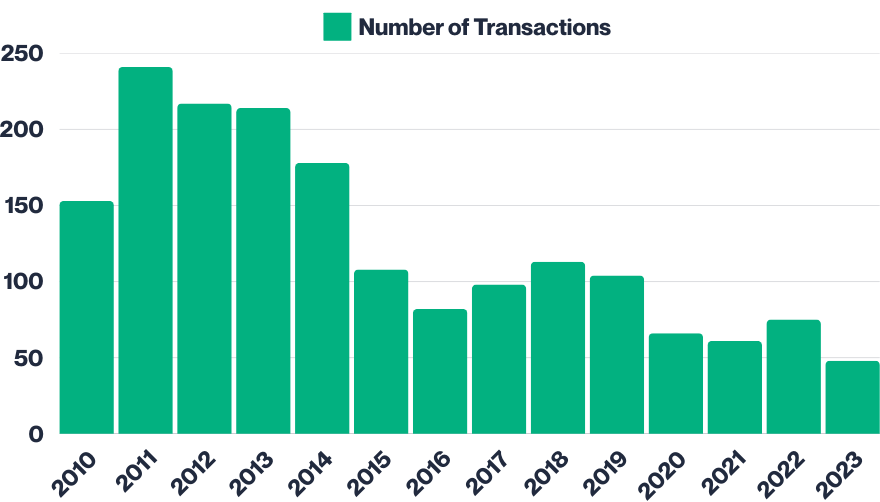
Number of Transactions - Apartment
- Total Transactions (2010 - 2023): 18327
- Average Transactions Per Year: 1309
- Year with Lowest Transactions: 2023 (921 transactions)
- Year with Highest Transactions: 2013 (1694 transactions)
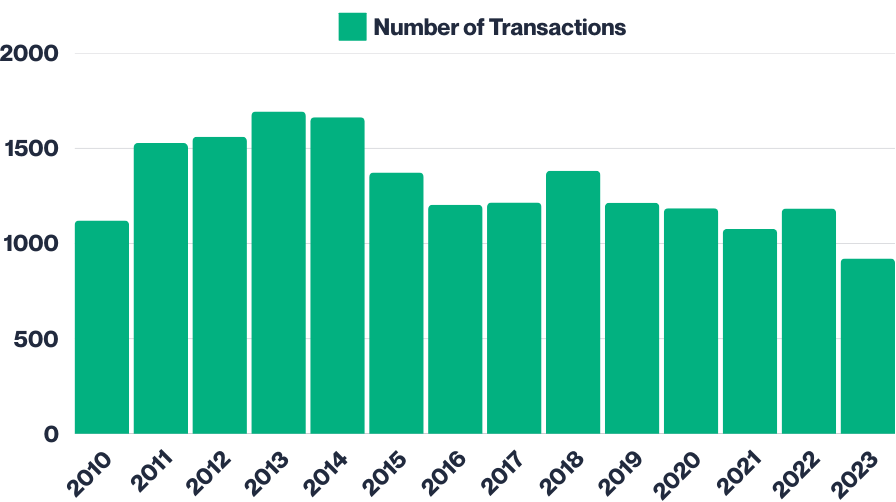
Graph based on selective NAPIC data
Number of Transactions - Condominium & Service Residence
- Total Transactions (2010 - 2023): 7246
- Average Transactions Per Year: 518
- Year with Lowest Transactions: 2023 (351 transactions)
- Year with Highest Transactions: 2013 (902 transactions)
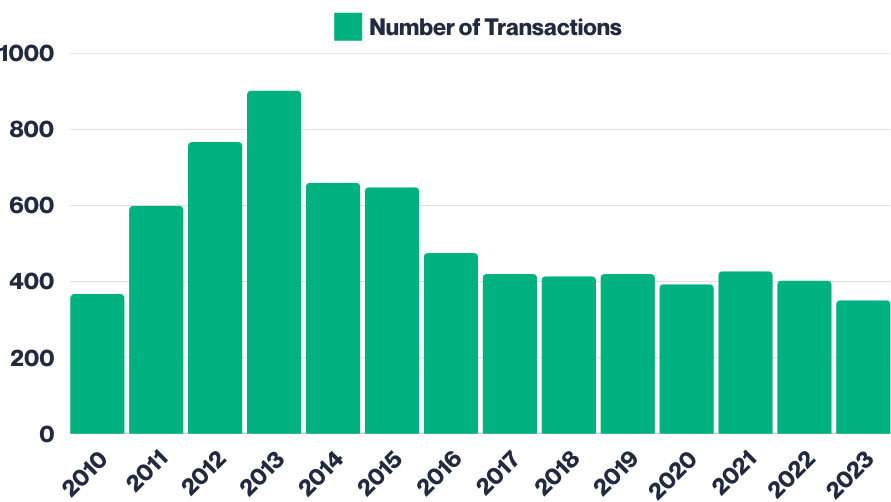
Graph based on selective NAPIC data
Number of Transactions - Detached
- Total Transactions (2010 - 2023): 6511
- Average Transactions Per Year: 465
- Year with Lowest Transactions: 2016 (353 transactions)
- Year with Highest Transactions: 2011 (885 transactions)
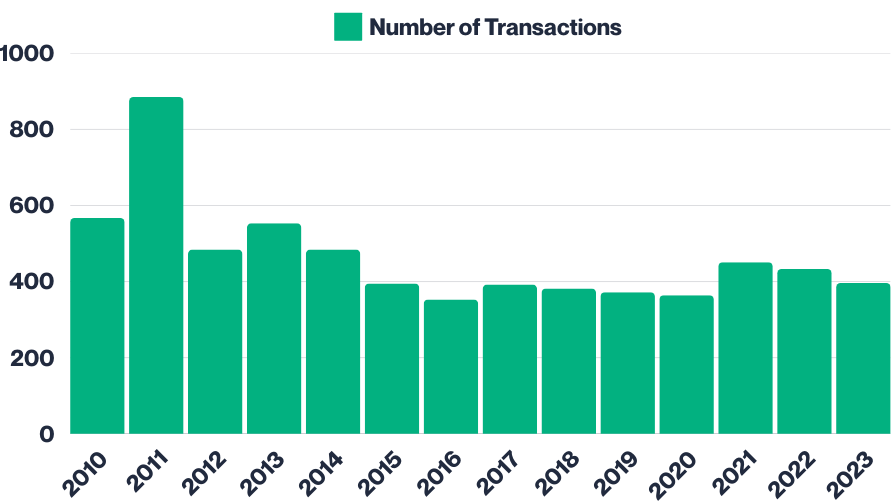
Graph based on selective NAPIC data
Number of Transactions - Semi-Detached
- Total Transactions (2010 - 2023): 3023
- Average Transactions Per Year: 216
- Year with Lowest Transactions: 2016 (158 transactions)
- Year with Highest Transactions: 2013 (317 transactions)
Graph based on selective NAPIC data
Number of Transactions - Townhouse
- Total Transactions (2010 - 2023): 1758
- Average Transactions Per Year: 126
- Year with Lowest Transactions: 2023 (48 transactions)
- Year with Highest Transactions: 2011 (241 transactions)
Graph based on selective NAPIC data
Median Price Trends for Common Property Types (2010–2023)
The graph below illustrates the median price trends for common property types in the Gombak District from 2010 to 2023.
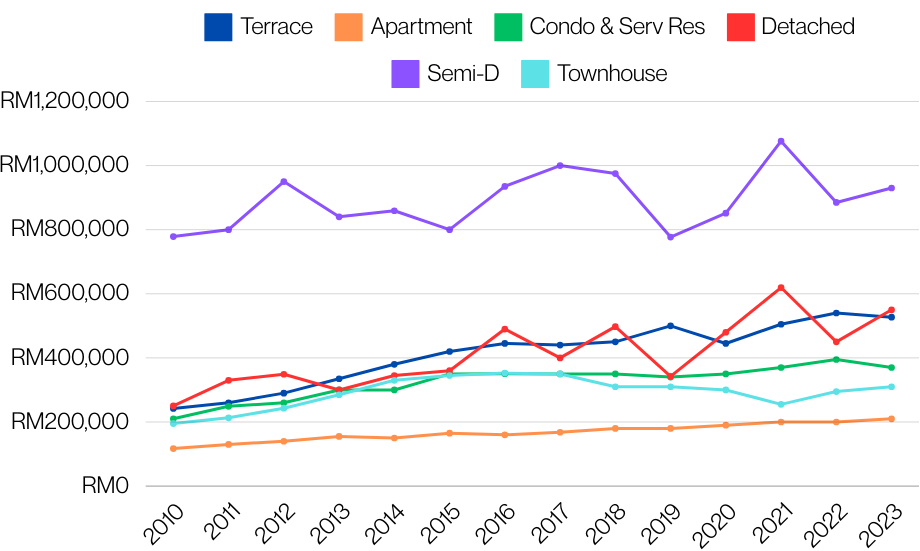
Graph based on selective NAPIC data
The table below provides a comprehensive overview of median property prices for various types of residential properties in the Gombak District from 2010 to 2023. This breakdown highlights market trends and the evolution of property values over time, offering valuable insights for buyers, investors, and analysts alike.
| Year | Terrace (RM) | Apartment (RM) | Condominium & Service Apartment (RM) | Detached (RM) | Semi-Detached (RM) | Townhouse (RM) |
|---|---|---|---|---|---|---|
| 2010 | 242,000 | 117,000 | 210,000 | 250,000 | 778,410 | 195,000 |
| 2011 | 260,000 | 130,000 | 249,000 | 330,050 | 800,000 | 213,000 |
| 2012 | 290,000 | 140,000 | 260,000 | 349,000 | 950,000 | 243,000 |
| 2013 | 335,000 | 155,000 | 300,000 | 300,000 | 840,000 | 285,000 |
| 2014 | 380,000 | 150,000 | 300,000 | 345,000 | 858,950 | 330,000 |
| 2015 | 420,000 | 165,000 | 350,000 | 360,000 | 800,000 | 345,000 |
| 2016 | 445,000 | 160,000 | 350,816 | 490,000 | 935,000 | 352,500 |
| 2017 | 440,000 | 168,000 | 350,000 | 400,000 | 1,000,000 | 350,000 |
| 2018 | 450,000 | 180,000 | 350,000 | 497,400 | 975,000 | 310,000 |
| 2019 | 500,000 | 180,000 | 340,000 | 342,500 | 776,800 | 310,000 |
| 2020 | 445,000 | 190,000 | 350,000 | 480,000 | 851,500 | 300,000 |
| 2021 | 505,000 | 200,000 | 370,000 | 619,440 | 1,076,000 | 255,000 |
| 2022 | 540,000 | 200,000 | 395,000 | 450,000 | 885,000 | 295,000 |
| 2023 | 527,000 | 210,000 | 370,000 | 550,000 | 930,000 | 310,000 |
- Table information based on selective NAPIC data
Terrace Price Distribution
The chart below highlights the distribution of terrace property prices in the Gombak District for 2023.
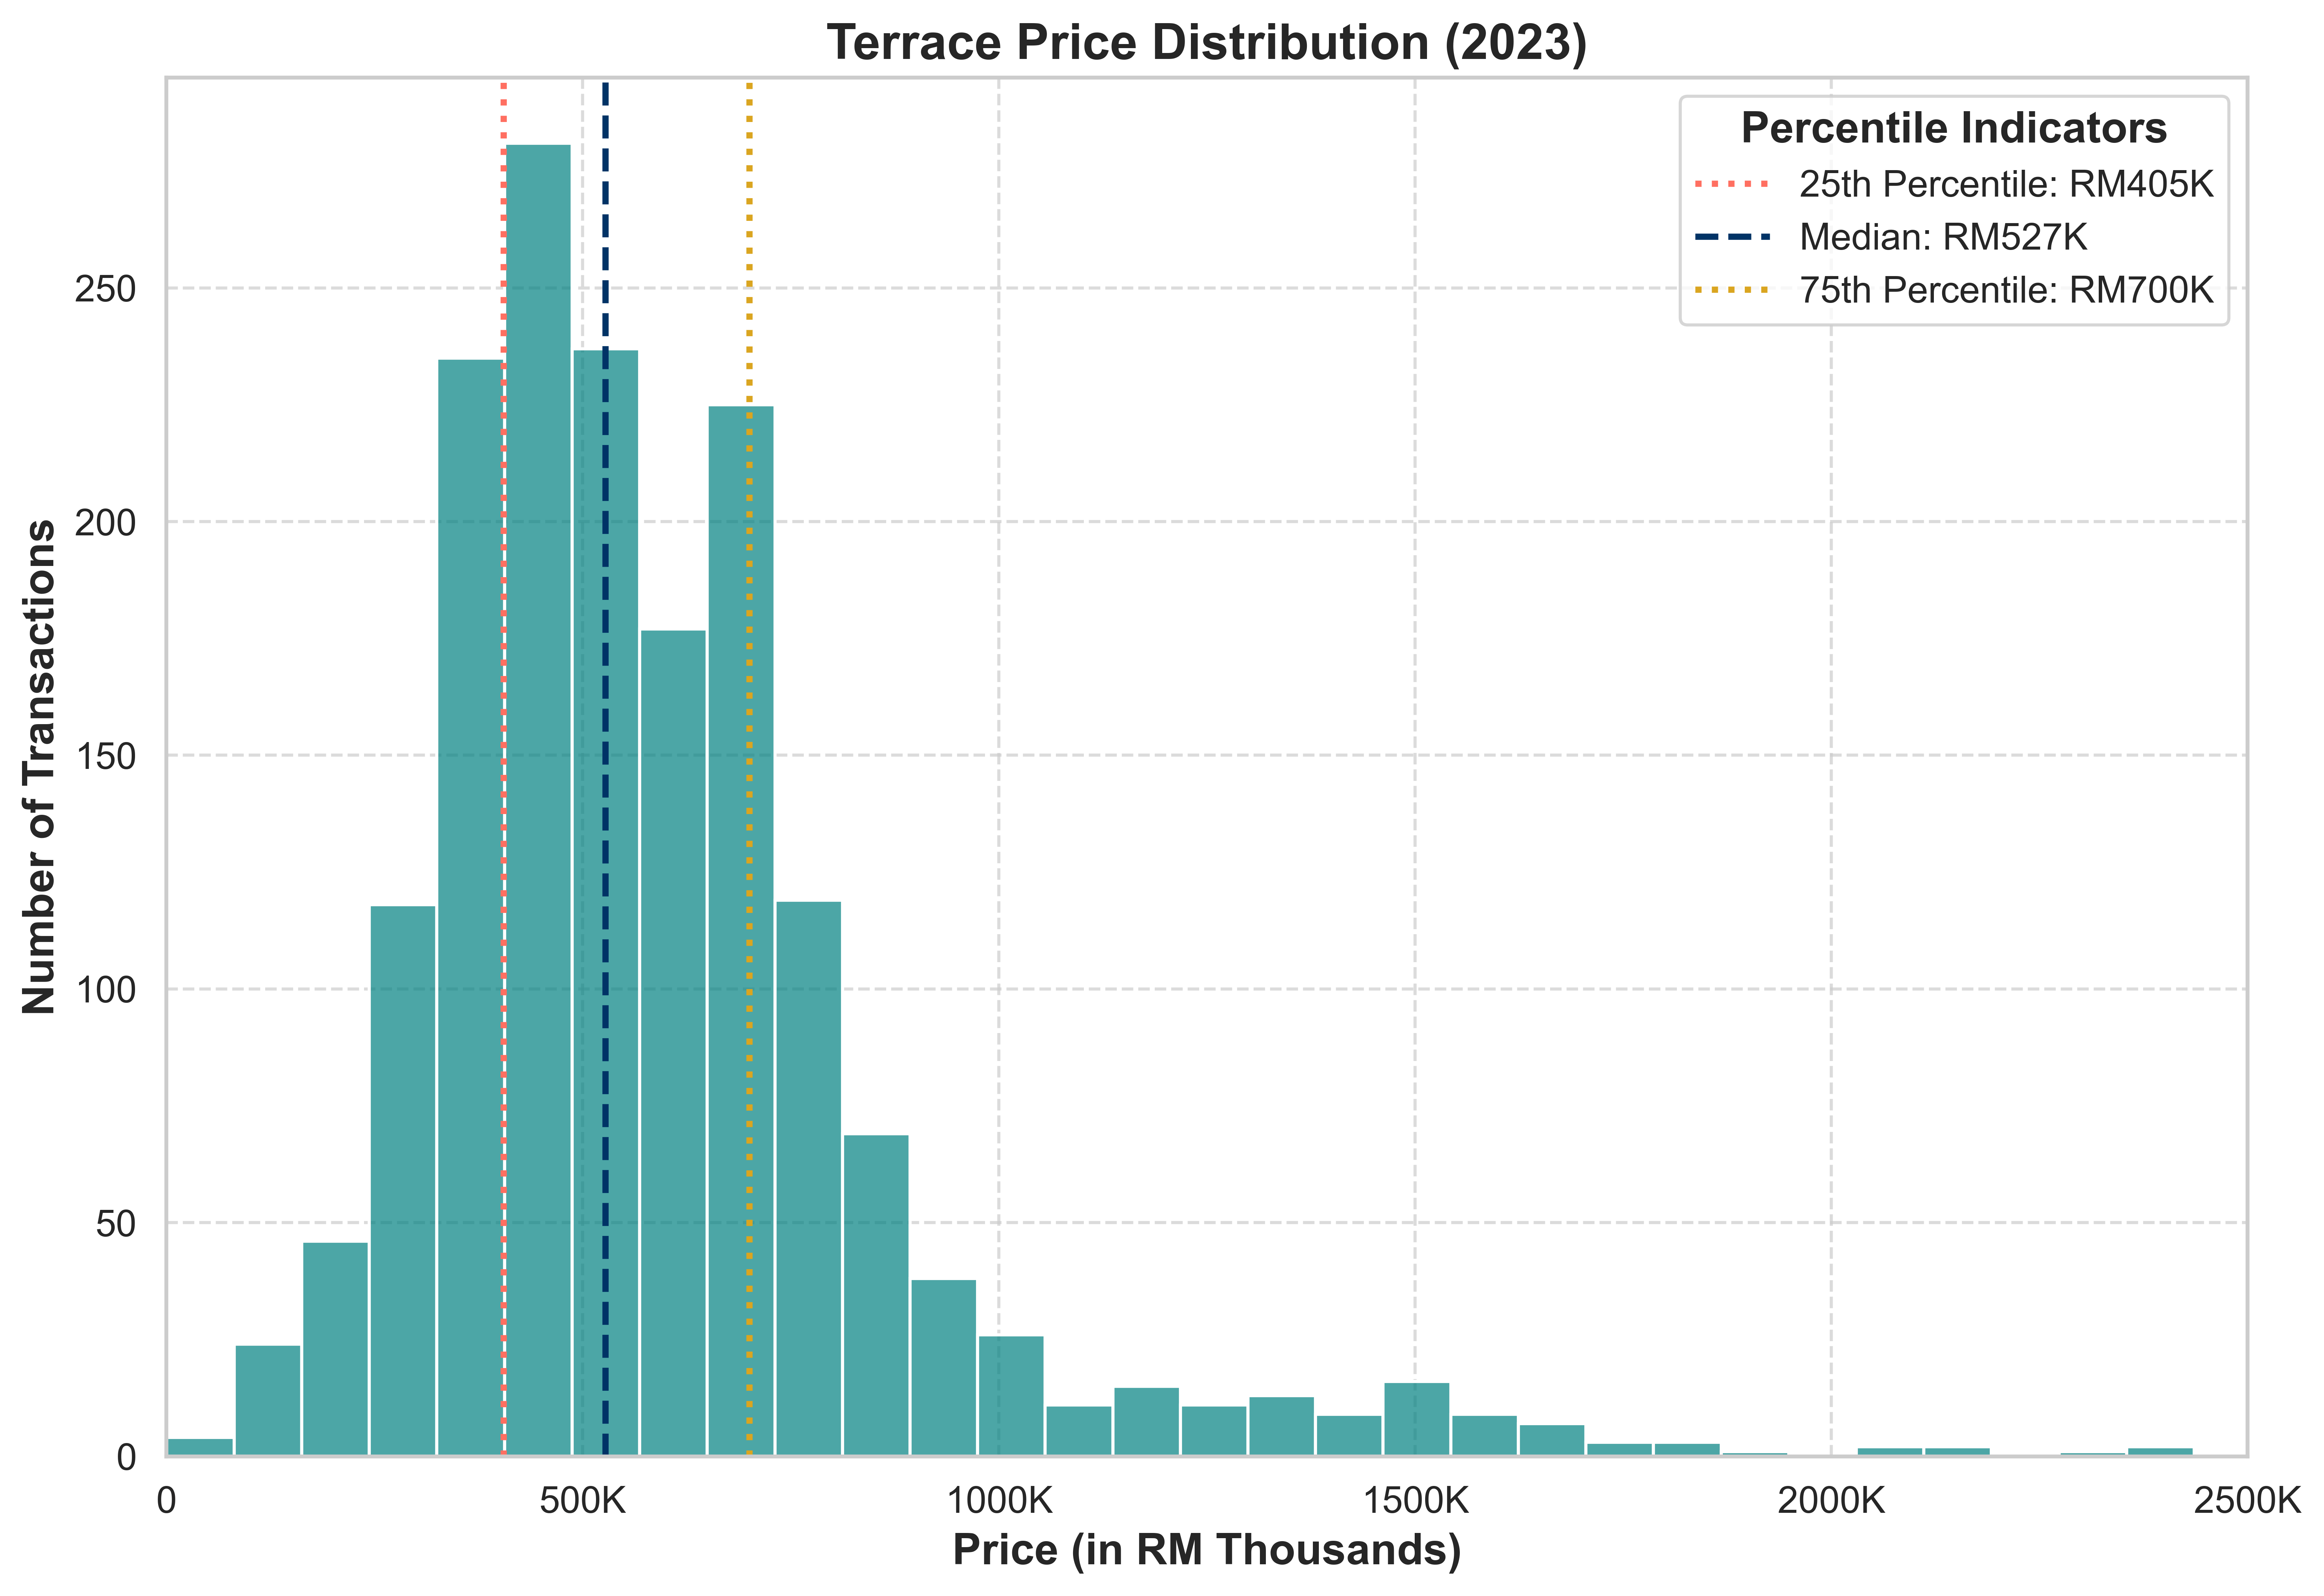
Graph based on selective NAPIC data
- 25th Percentile: RM 405k (427 transactions below RM 405k)
- 75th Percentile: RM 700k (404 transactions above RM 700k)
- Bulk of Transactions: 873 transactions (Between RM 405k and RM 700k)
- Total Transactions for 2023: 1708
Apartment Price Distribution
The chart below highlights the distribution of apartment prices in the Gombak District for 2023.
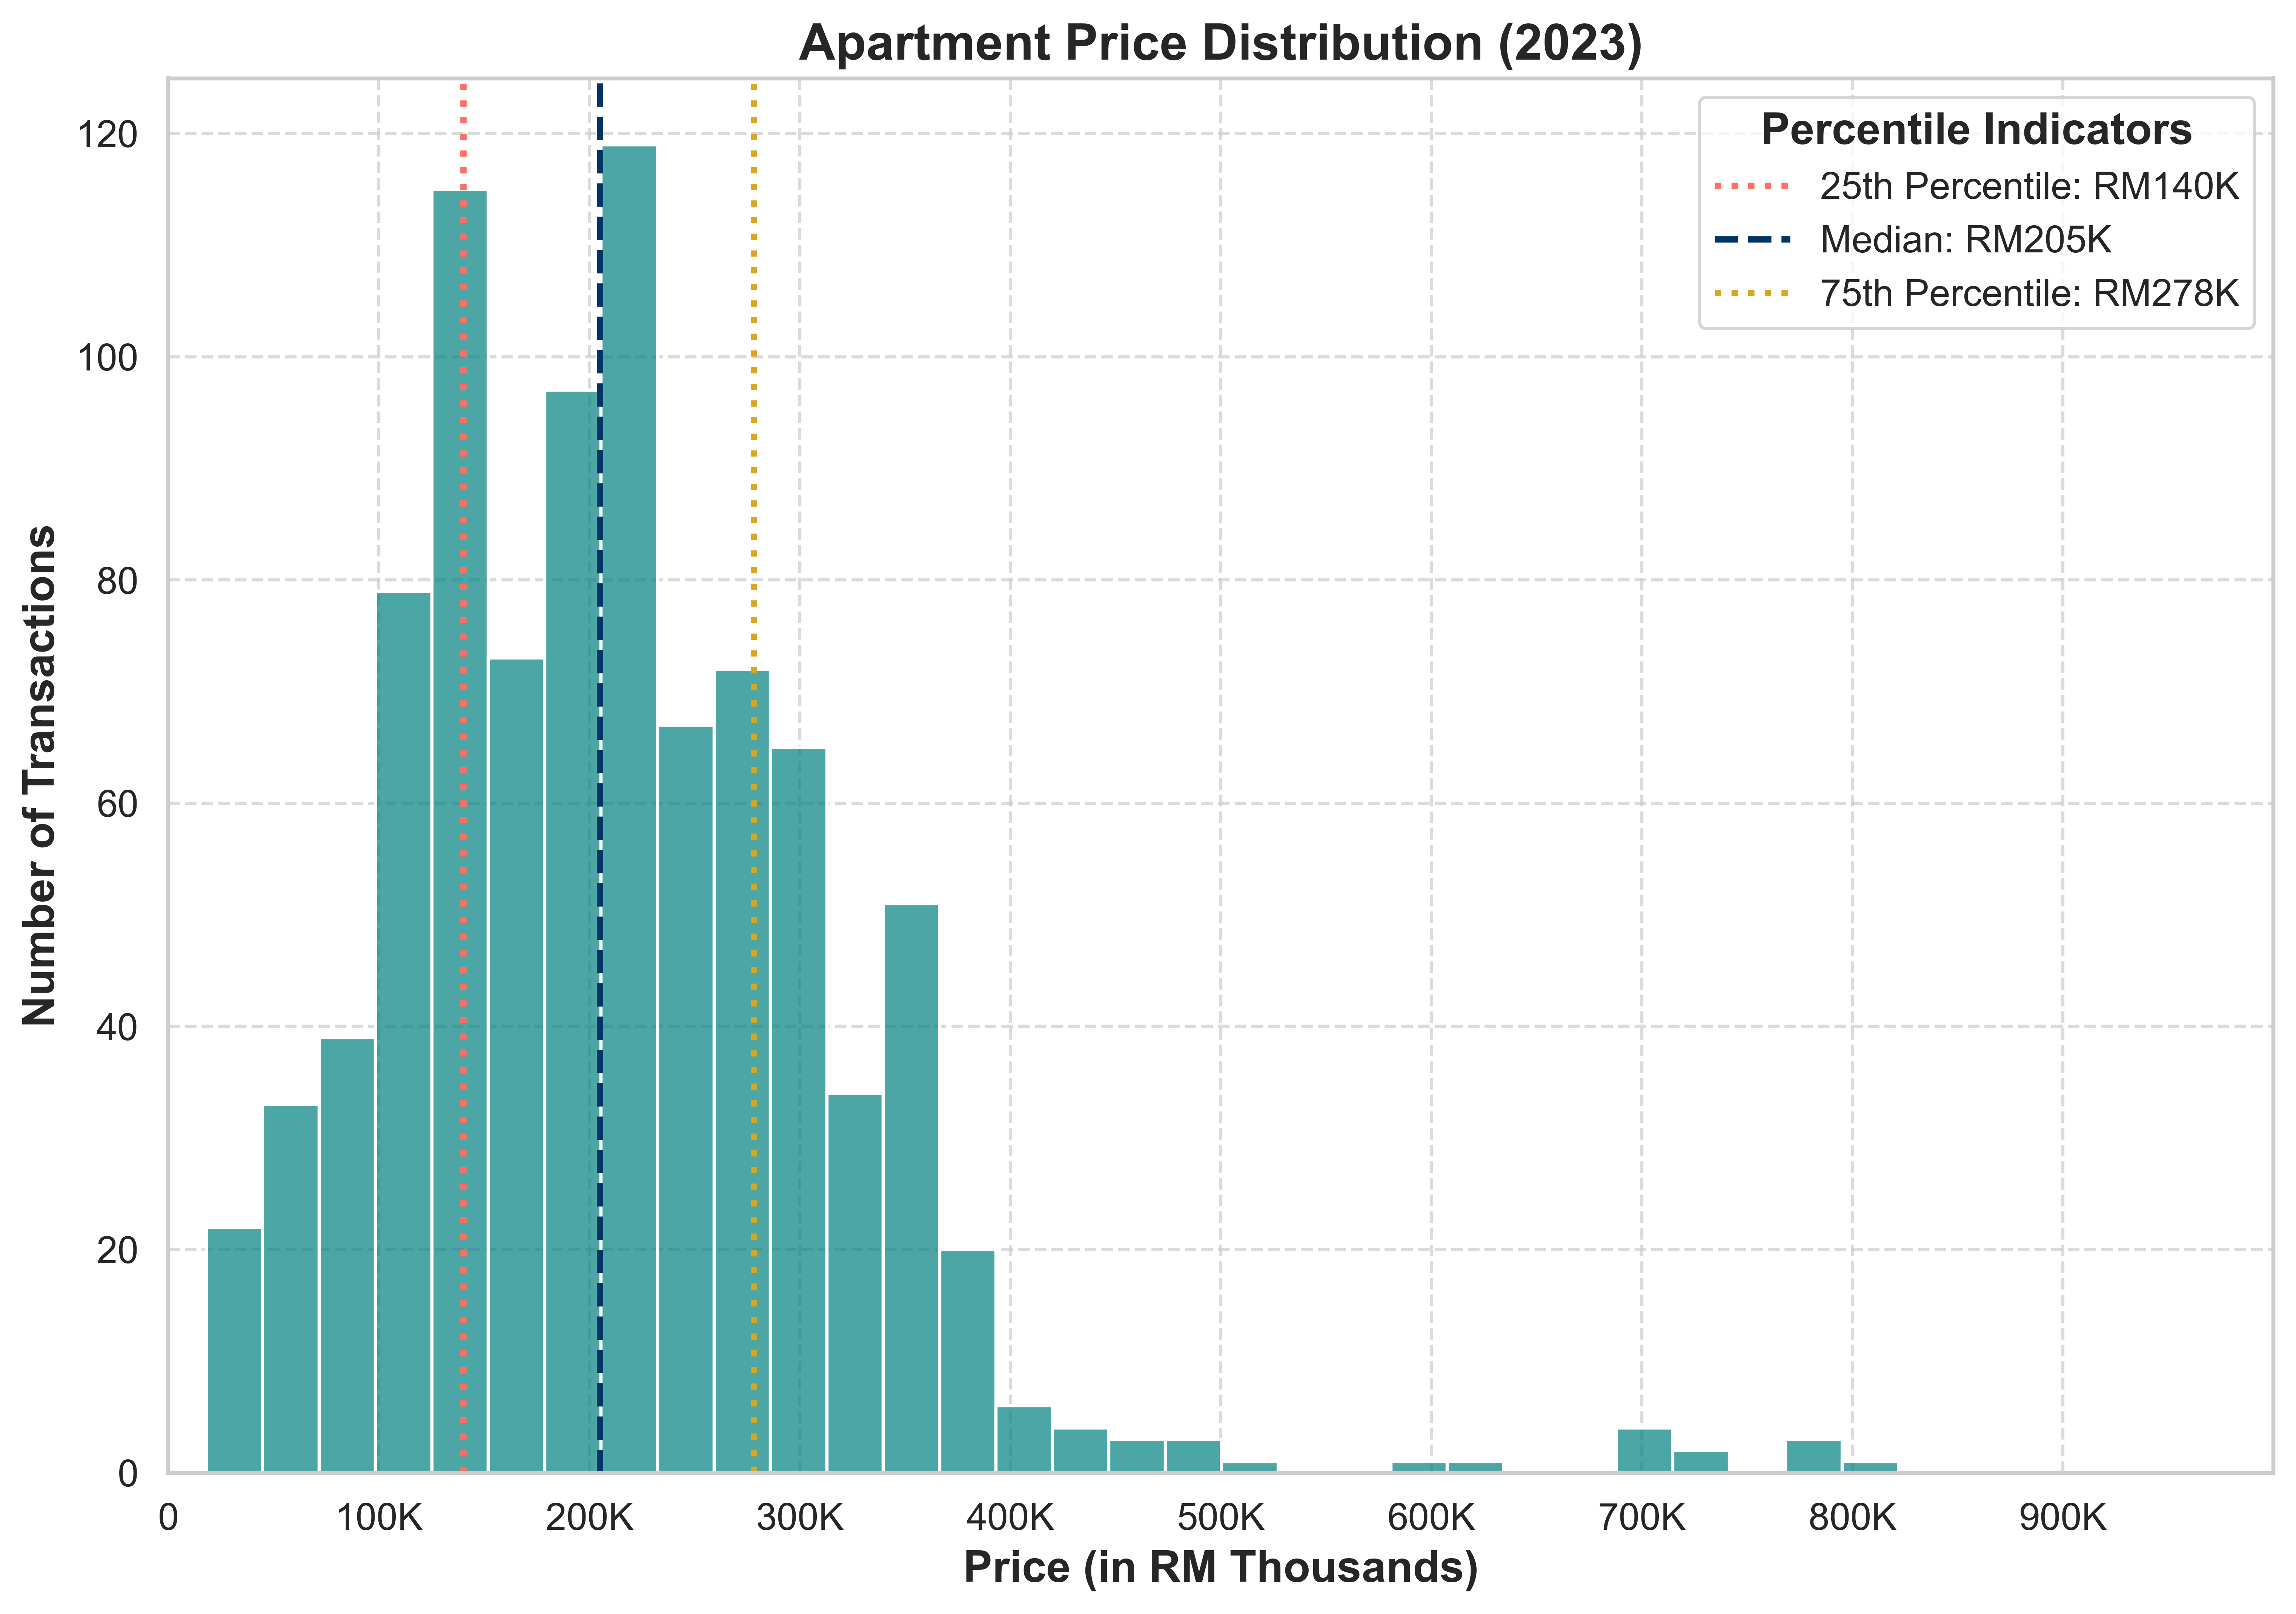
Graph based on selective NAPIC data
- 25th Percentile: RM 140k (230 transactions below RM 140k)
- 75th Percentile: RM 278k (228 transactions above RM 278k)
- Bulk of Transactions: 457 transactions (Between RM 140k and RM 278k)
- Total Transactions for 2023: 921
Condominium and Service Apartment Price Distribution
The chart below highlights the price distribution of condominiums and service apartments in the Gombak District for 2023.
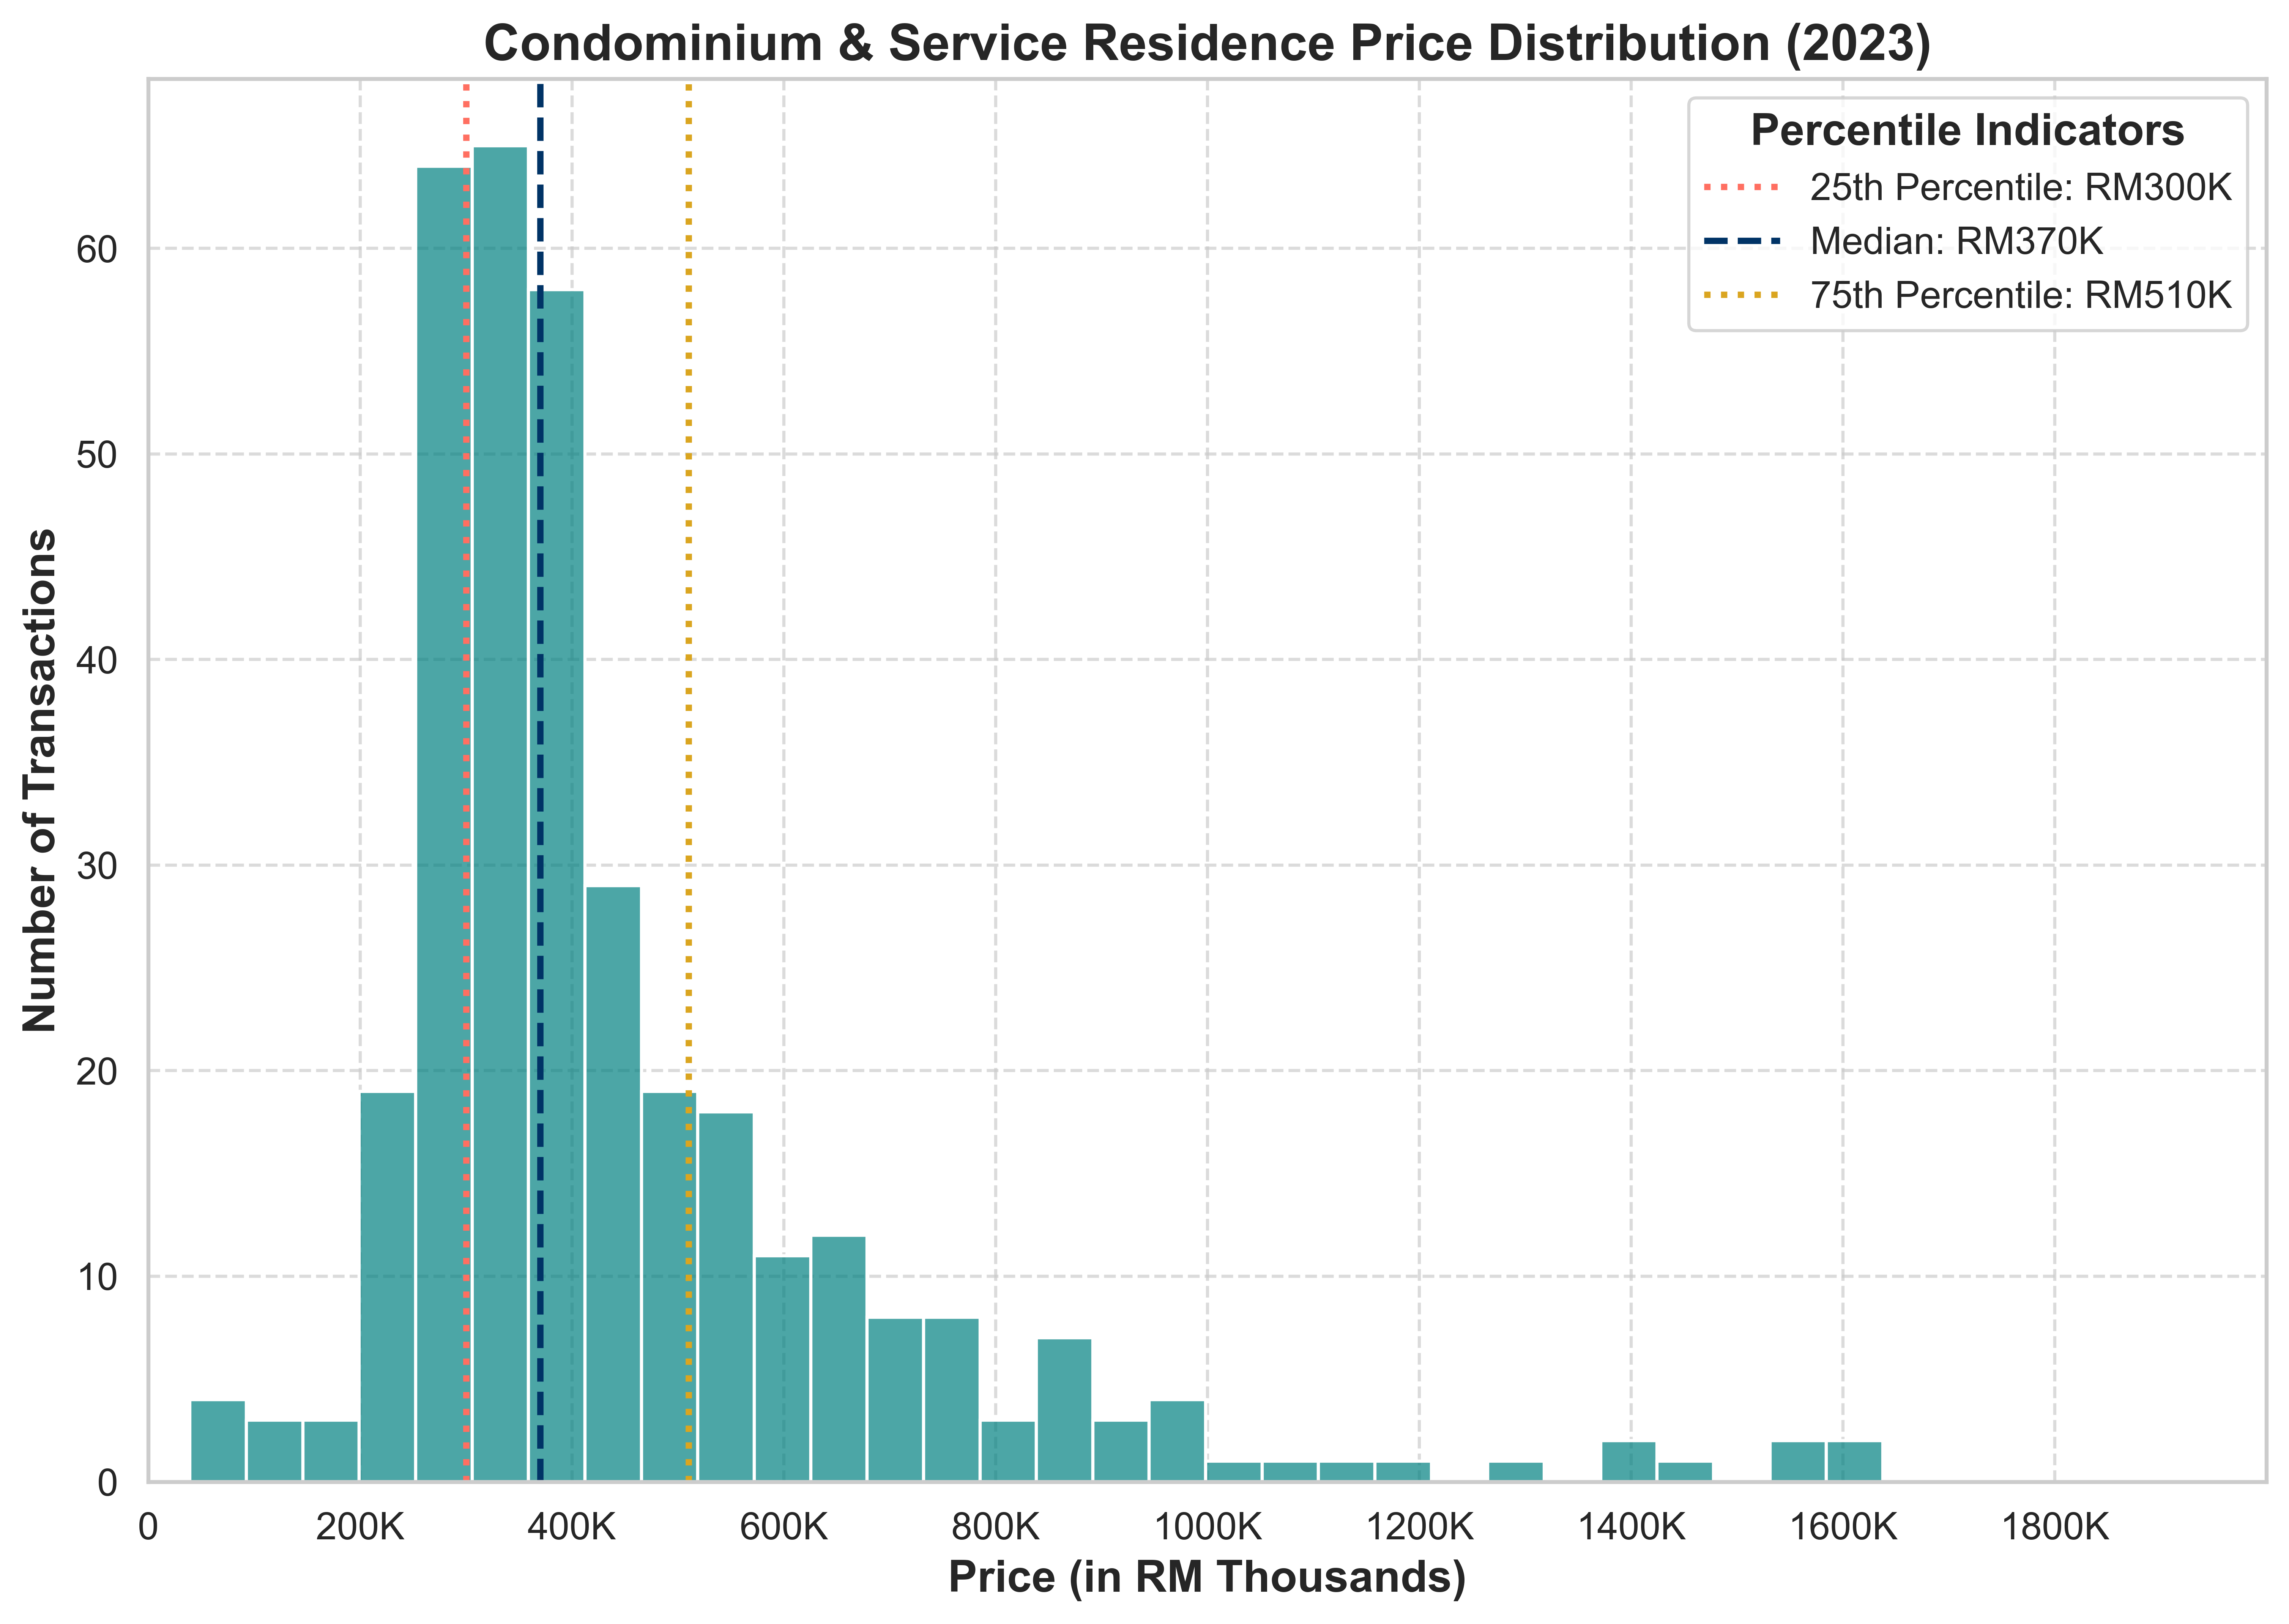
Graph based on selective NAPIC data
- 25th Percentile: RM 300k (92 transactions below RM 300k)
- 75th Percentile: RM 510k (87 transactions above RM 510k)
- Bulk of Transactions: 171 transactions (Between RM 300k and RM 510k)
- Total Transactions for 2023: 351
Detached Price Distribution
The chart below highlights the price distribution of detached houses in the Gombak District for 2023.
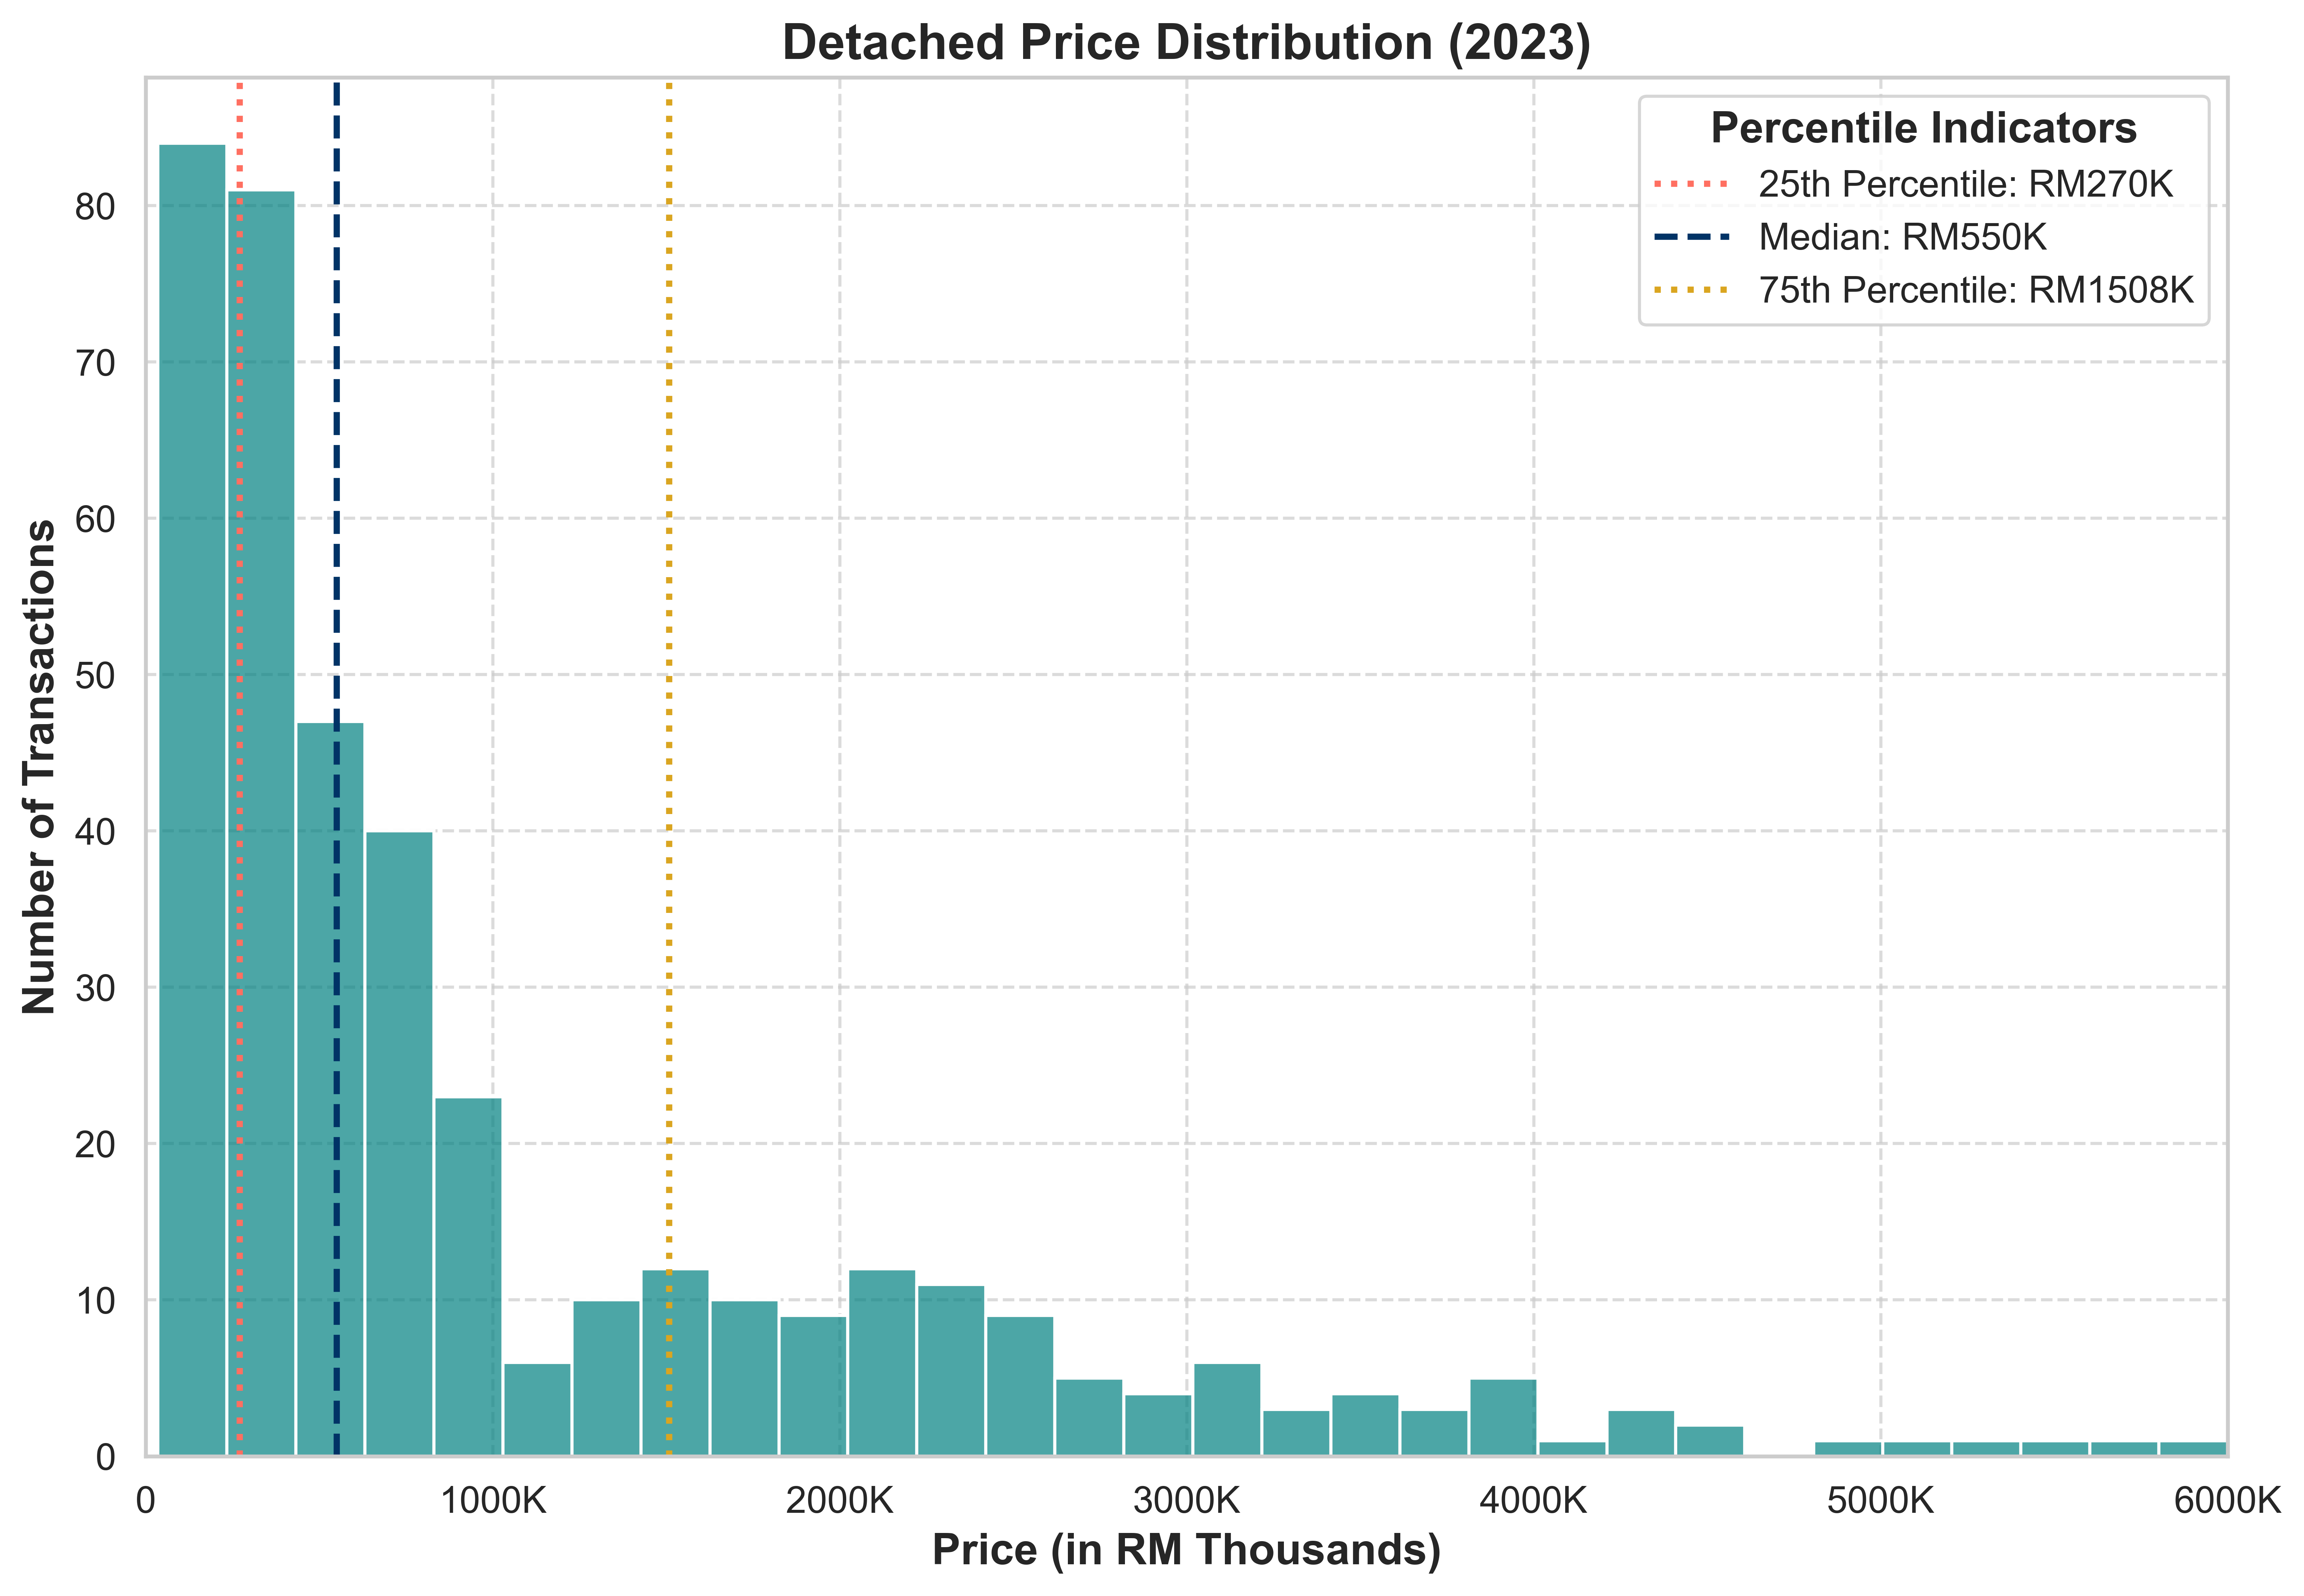
Graph based on selective NAPIC data
- 25th Percentile: RM 270k (101 transactions below RM 270k)
- 75th Percentile: RM 1508k (99 transactions above RM 1508k)
- Bulk of Transactions: 196 transactions (Between RM 270k and RM 1508k)
- Total Transactions for 2023: 396
Semi-Detached Price Distribution
The chart below highlights the price distribution of semi-detached houses in the Gombak District for 2023.
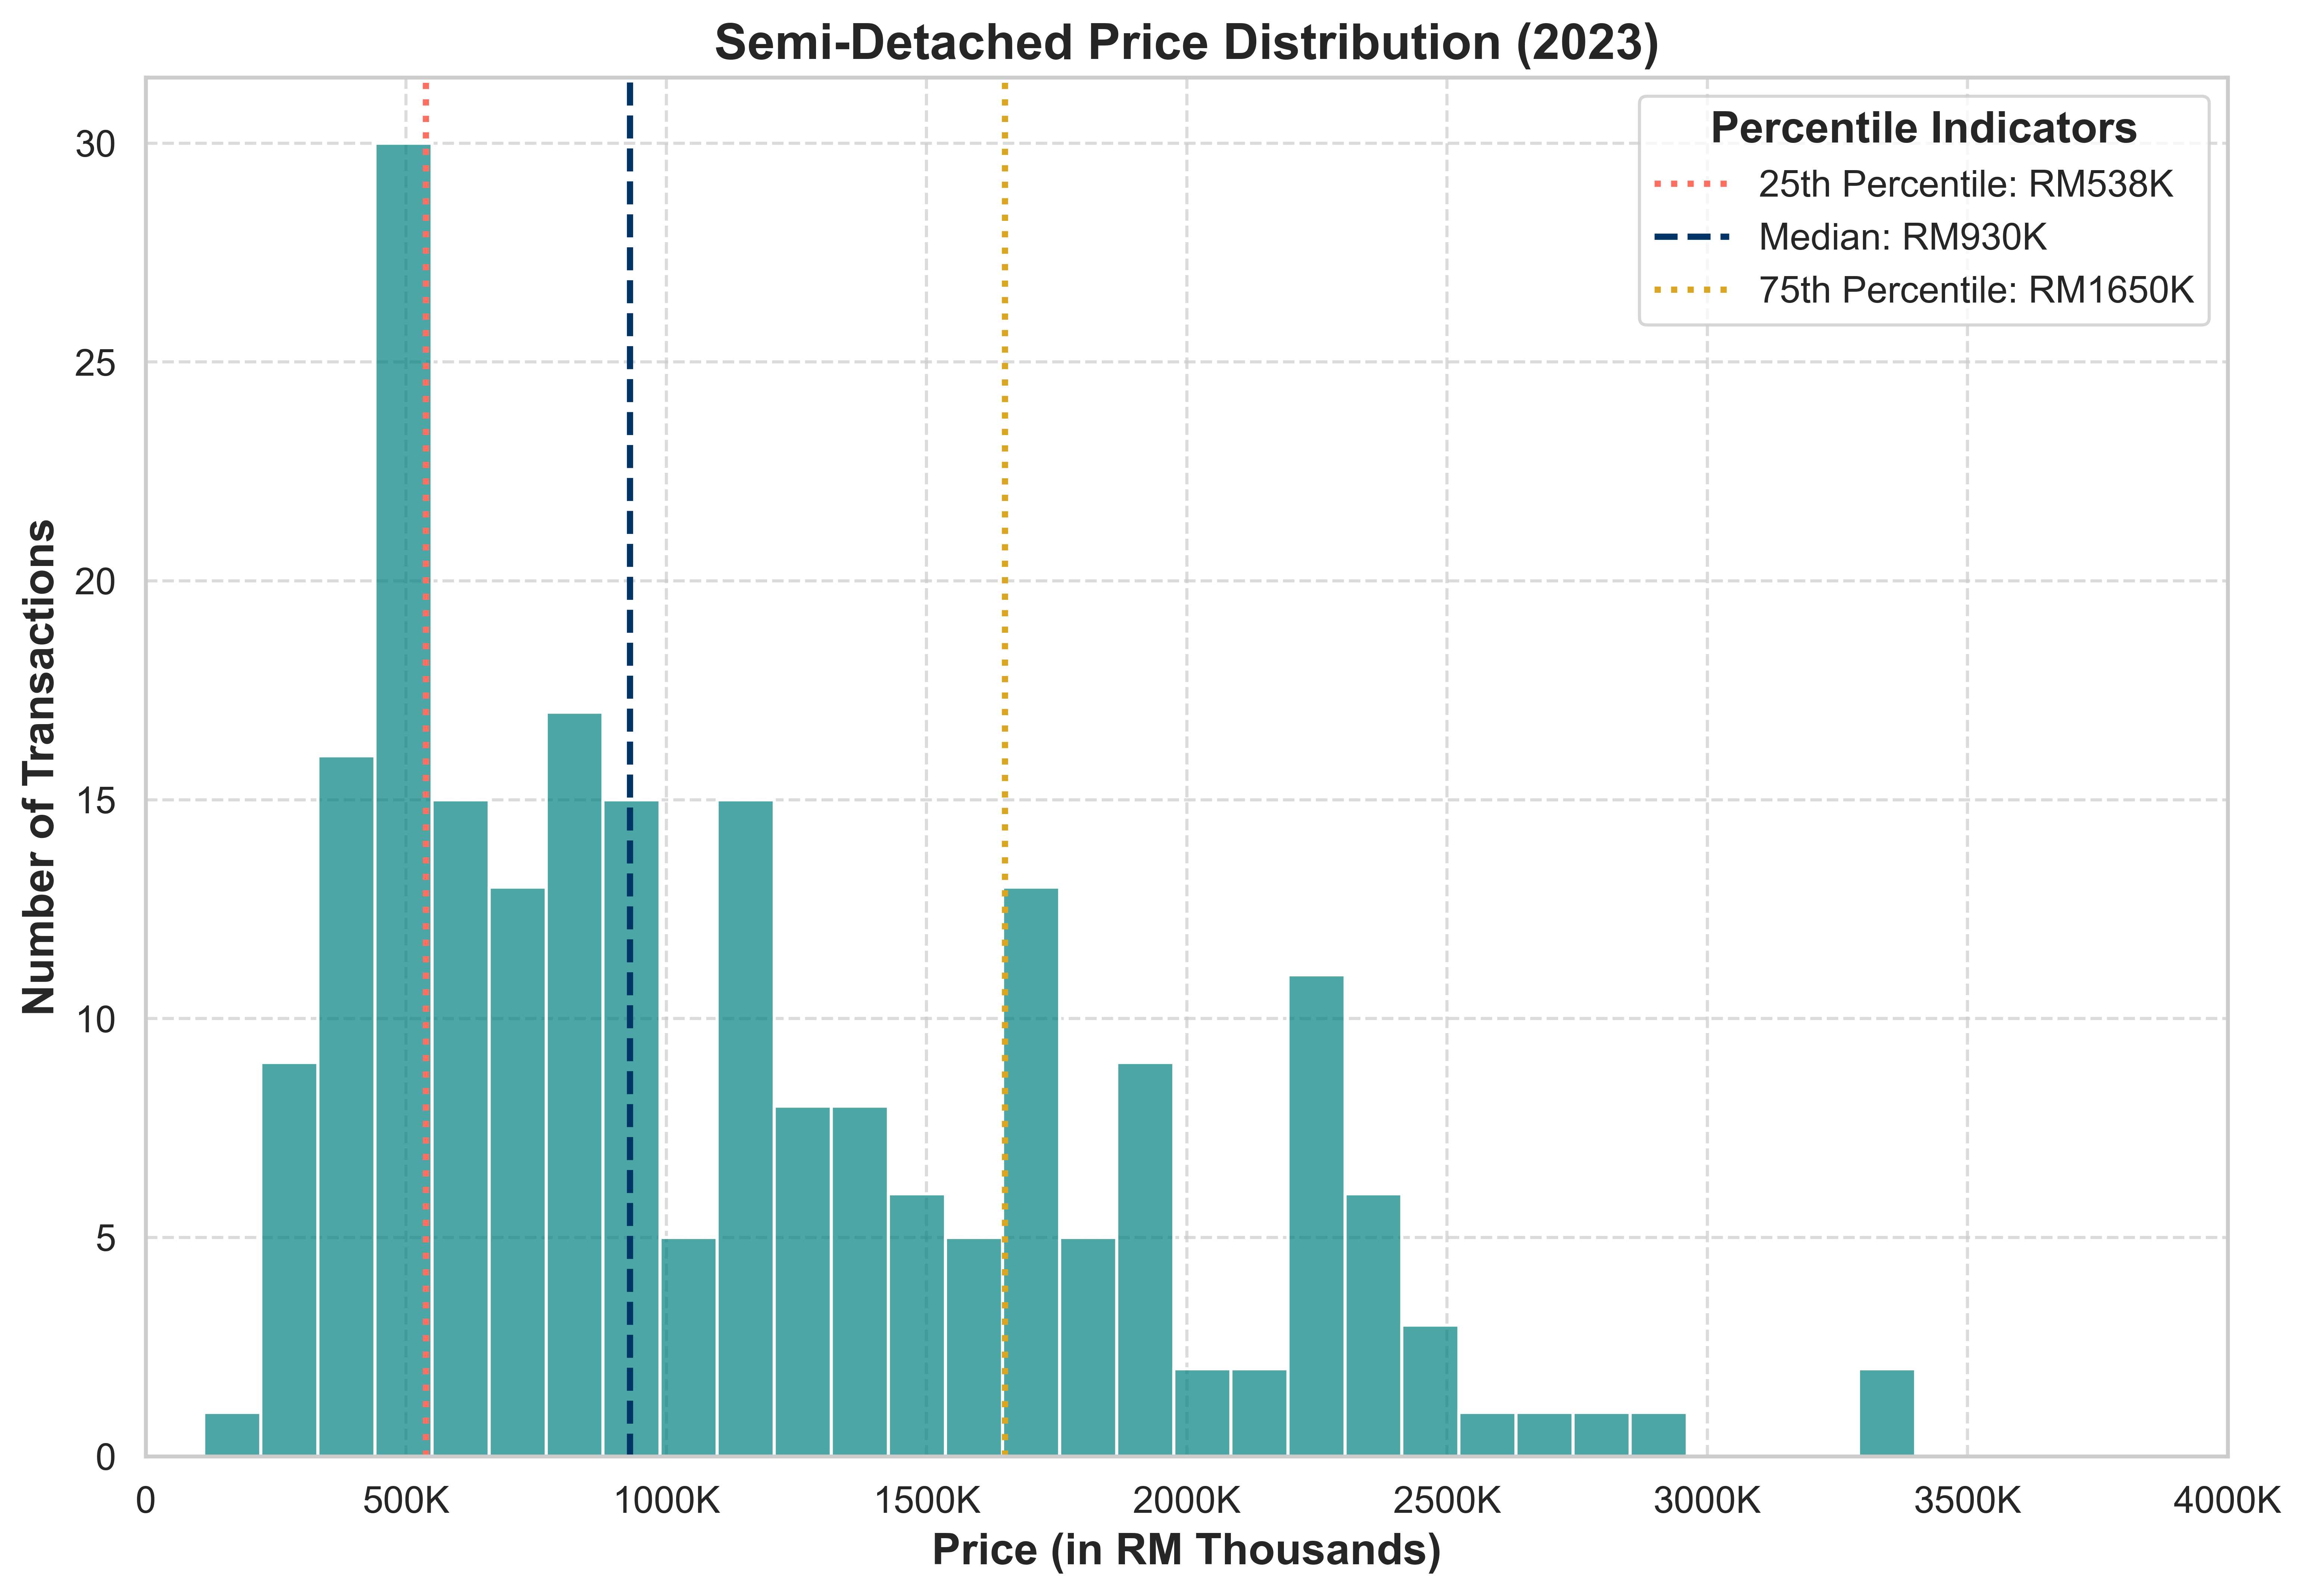
Graph based on selective NAPIC data
- 25th Percentile: RM 538k (55 transactions below RM 538k)
- 75th Percentile: RM 1650k (51 transactions above RM 1650k)
- Bulk of Transactions: 114 transactions (Between RM 538k and RM 1650k)
- Total Transactions for 2023: 220
Townhouse Price Distribution
The chart below highlights the price distribution of townhouses in the Gombak District for 2023.
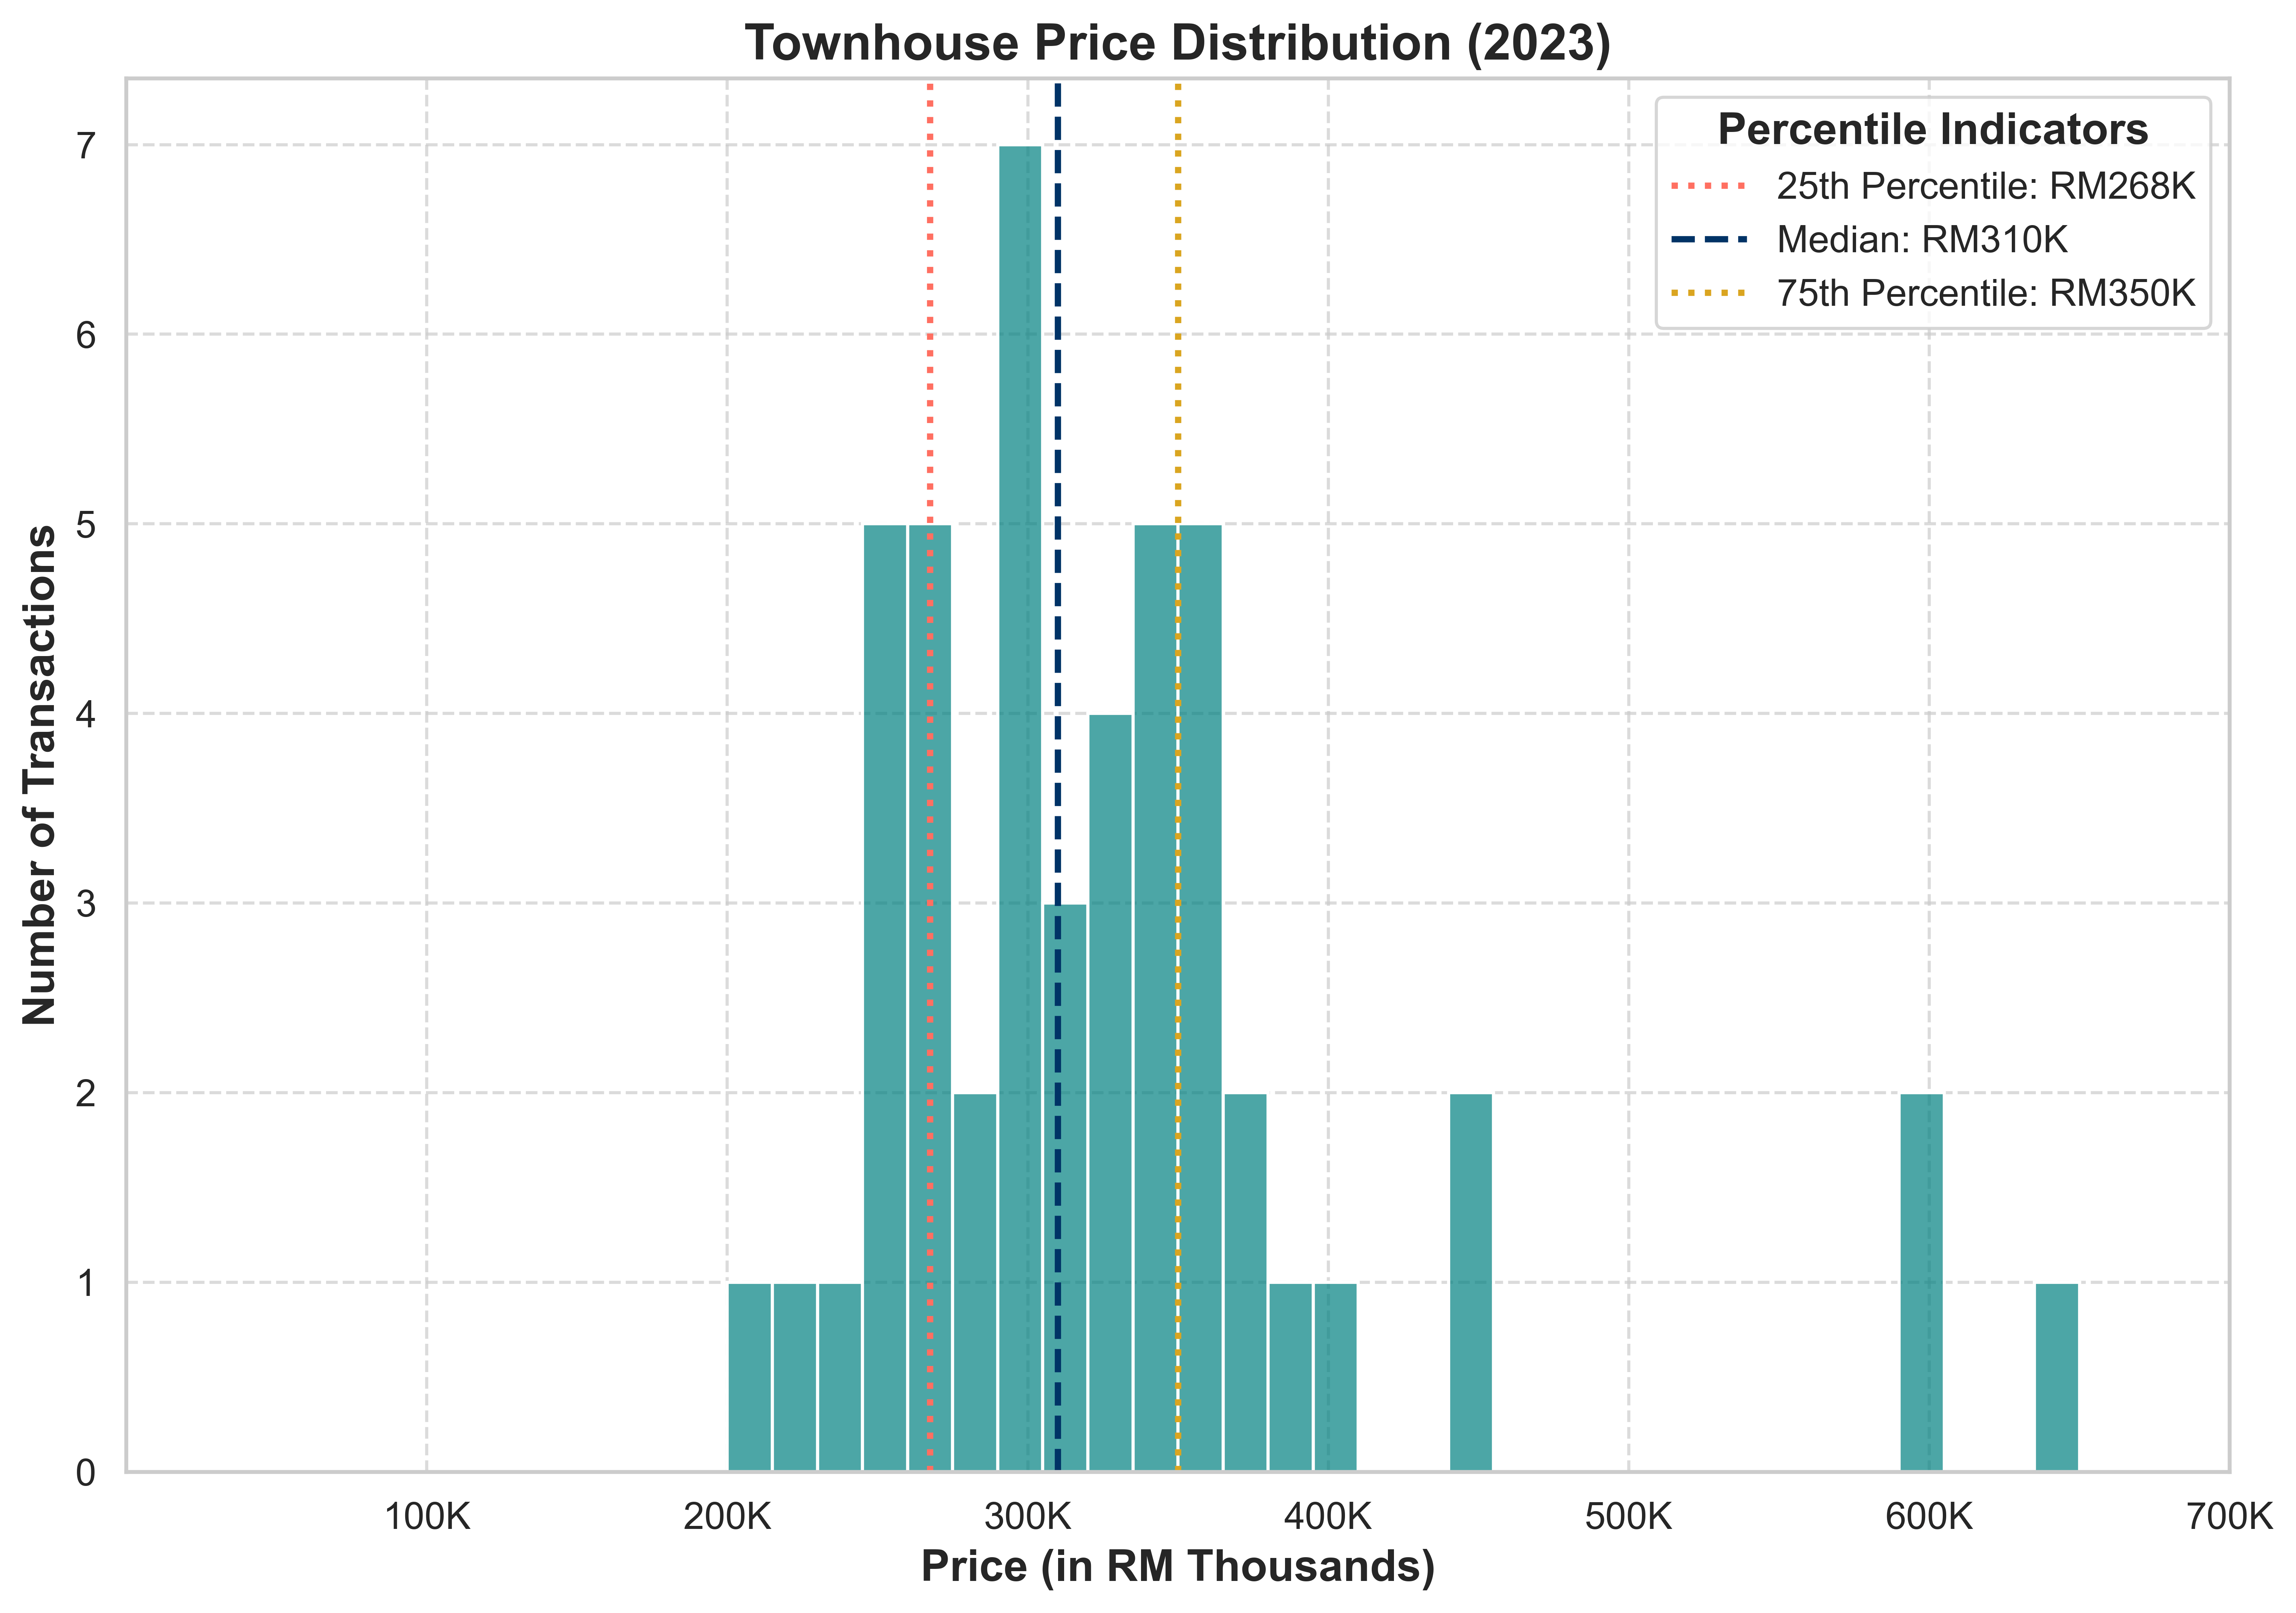
Graph based on selective NAPIC data
- 25th Percentile: RM 268k (12 transactions below RM 268k)
- 75th Percentile: RM 350k (10 transactions above RM 350k)
- Bulk of Transactions: 26 transactions (Between RM 268k and RM 350k)
- Total Transactions for 2023: 48