Is Affordability An Issue In The Klang Valley?
Key Findings
- Baseline Selection:
- The study focused on terrace homes as the baseline property type for assessing affordability trends.
- Data Segmentation:
- Terrace property transactions from 2019 to 2023 were analysed, and locations with the highest number of transactions were shortlisted.
- The total transaction value for each area was calculated, and the average unit price (AUP) was derived by dividing the total value by the number of transactions for each location.
- These locations were then categorized into four price groups based on their AUP:
- Group A: RM 800k and above
- Group B: RM 600k – RM 800k
- Group C: RM 400k – RM 600k
- Group D: RM 180k – RM 400k
- Transaction Distribution:
- The transaction counts across the four price groups revealed the following distribution:
- Group A (RM 800k and above): 8,429 transactions
- Group B (RM 600k – RM 800k): 13,397 transactions
- Group C (RM 400k – RM 600k): 10,012 transactions
- Group D (RM 180k – RM 400k): 8,316 transactions
- The transaction counts across the four price groups revealed the following distribution:
- Key Observations:
- Transaction counts are evenly distributed across all price groups, highlighting a vibrant market that caters to diverse affordability levels, from high-end to lower-cost homes.
- The RM 400k–RM 800k AUP range is the most common, with over 23,000 transactions across Groups B and C from 2019 to 2023.
- Location data reveals a clear trend: higher-priced homes are concentrated in well-established urban areas, while lower-priced homes are increasingly situated farther from the city, in the outskirts of the Klang Valley. See maps below.
- Affordability is further shaped by local income levels—2022 data shows Selangor’s median monthly household income at RM9,983 and Kuala Lumpur’s at RM10,234—indicating that many buyers are willing to compromise on location to find affordable options further away from the city centre [1].
- Homes in these outer areas are typically geared towards owner-occupancy rather than investment, as city-proximal properties are easier to rent out due to office density and industries.
- Improved transportation networks and the appeal of modern, family-oriented suburban developments with communal facilities also contribute to this trend.
- While affordable homes remain available, they often require buyers to balance cost savings with increased commuting distances.
- https://data.gov.my/data-catalogue/hh_income_state
Group A - RM 800k and Above
| # | Location | Number of Transactions | Total Value (RM - Million) | Average Unit Price |
|---|---|---|---|---|
| 1 | TMN TUN DR ISMAIL | 258 | 376 | RM1,456,437 |
| 2 | JADE HILLS | 214 | 308 | RM1,440,449 |
| 3 | BANDAR UTAMA | 488 | 678 | RM1,390,254 |
| 4 | BANDAR SIERRA PUCHONG | 236 | 272 | RM1,151,136 |
| 5 | SEJATI LAKESIDE | 197 | 224 | RM1,135,955 |
| 6 | BANDAR PUTERI | 273 | 282 | RM1,033,603 |
| 7 | SS 2 | 352 | 361 | RM1,025,600 |
| 8 | BUKIT JELUTONG | 330 | 334 | RM1,012,505 |
| 9 | BANDAR METRO PUCHONG | 220 | 217 | RM984,506 |
| 10 | ELMINA WEST | 905 | 865 | RM955,269 |
| 11 | DENAI ALAM | 369 | 345 | RM934,795 |
| 12 | BANDAR KINRARA | 877 | 816 | RM930,968 |
| 13 | ALAM IMPIAN | 689 | 615 | RM892,927 |
| 14 | BANDAR SRI DAMANSARA | 416 | 369 | RM886,542 |
| 15 | TMN PUTRA PRIMA | 436 | 376 | RM863,044 |
| 16 | BANDAR SERI COALFIELDS | 499 | 429 | RM859,533 |
| 17 | PUTERA HEIGHTS | 510 | 431 | RM845,290 |
| 18 | ECO MAJESTIC | 548 | 461 | RM841,396 |
| 19 | USJ 11 | 217 | 181 | RM832,073 |
| 20 | KOTA KEMUNING | 395 | 323 | RM817,822 |
- Table information based on selective NAPIC data from 2019 - 2023
- In the first half of Group A, Elmina West (#10) recorded the highest number of transactions and highest total value.
- In the second half of Group A, Bandar Kinrara (#12) recorded the highest number of transactions and highest total value.

Map: © OpenStreetMap contributors | Basemap: © Carto | Powered by Leaflet
- As shown on the map above, most locations in Group A are clustered in well-established areas such as Puchong, Subang, Petaling Jaya, and Shah Alam.
- However, some locations are further from the city center but still achieve sales at this price range (RM 800k and above).
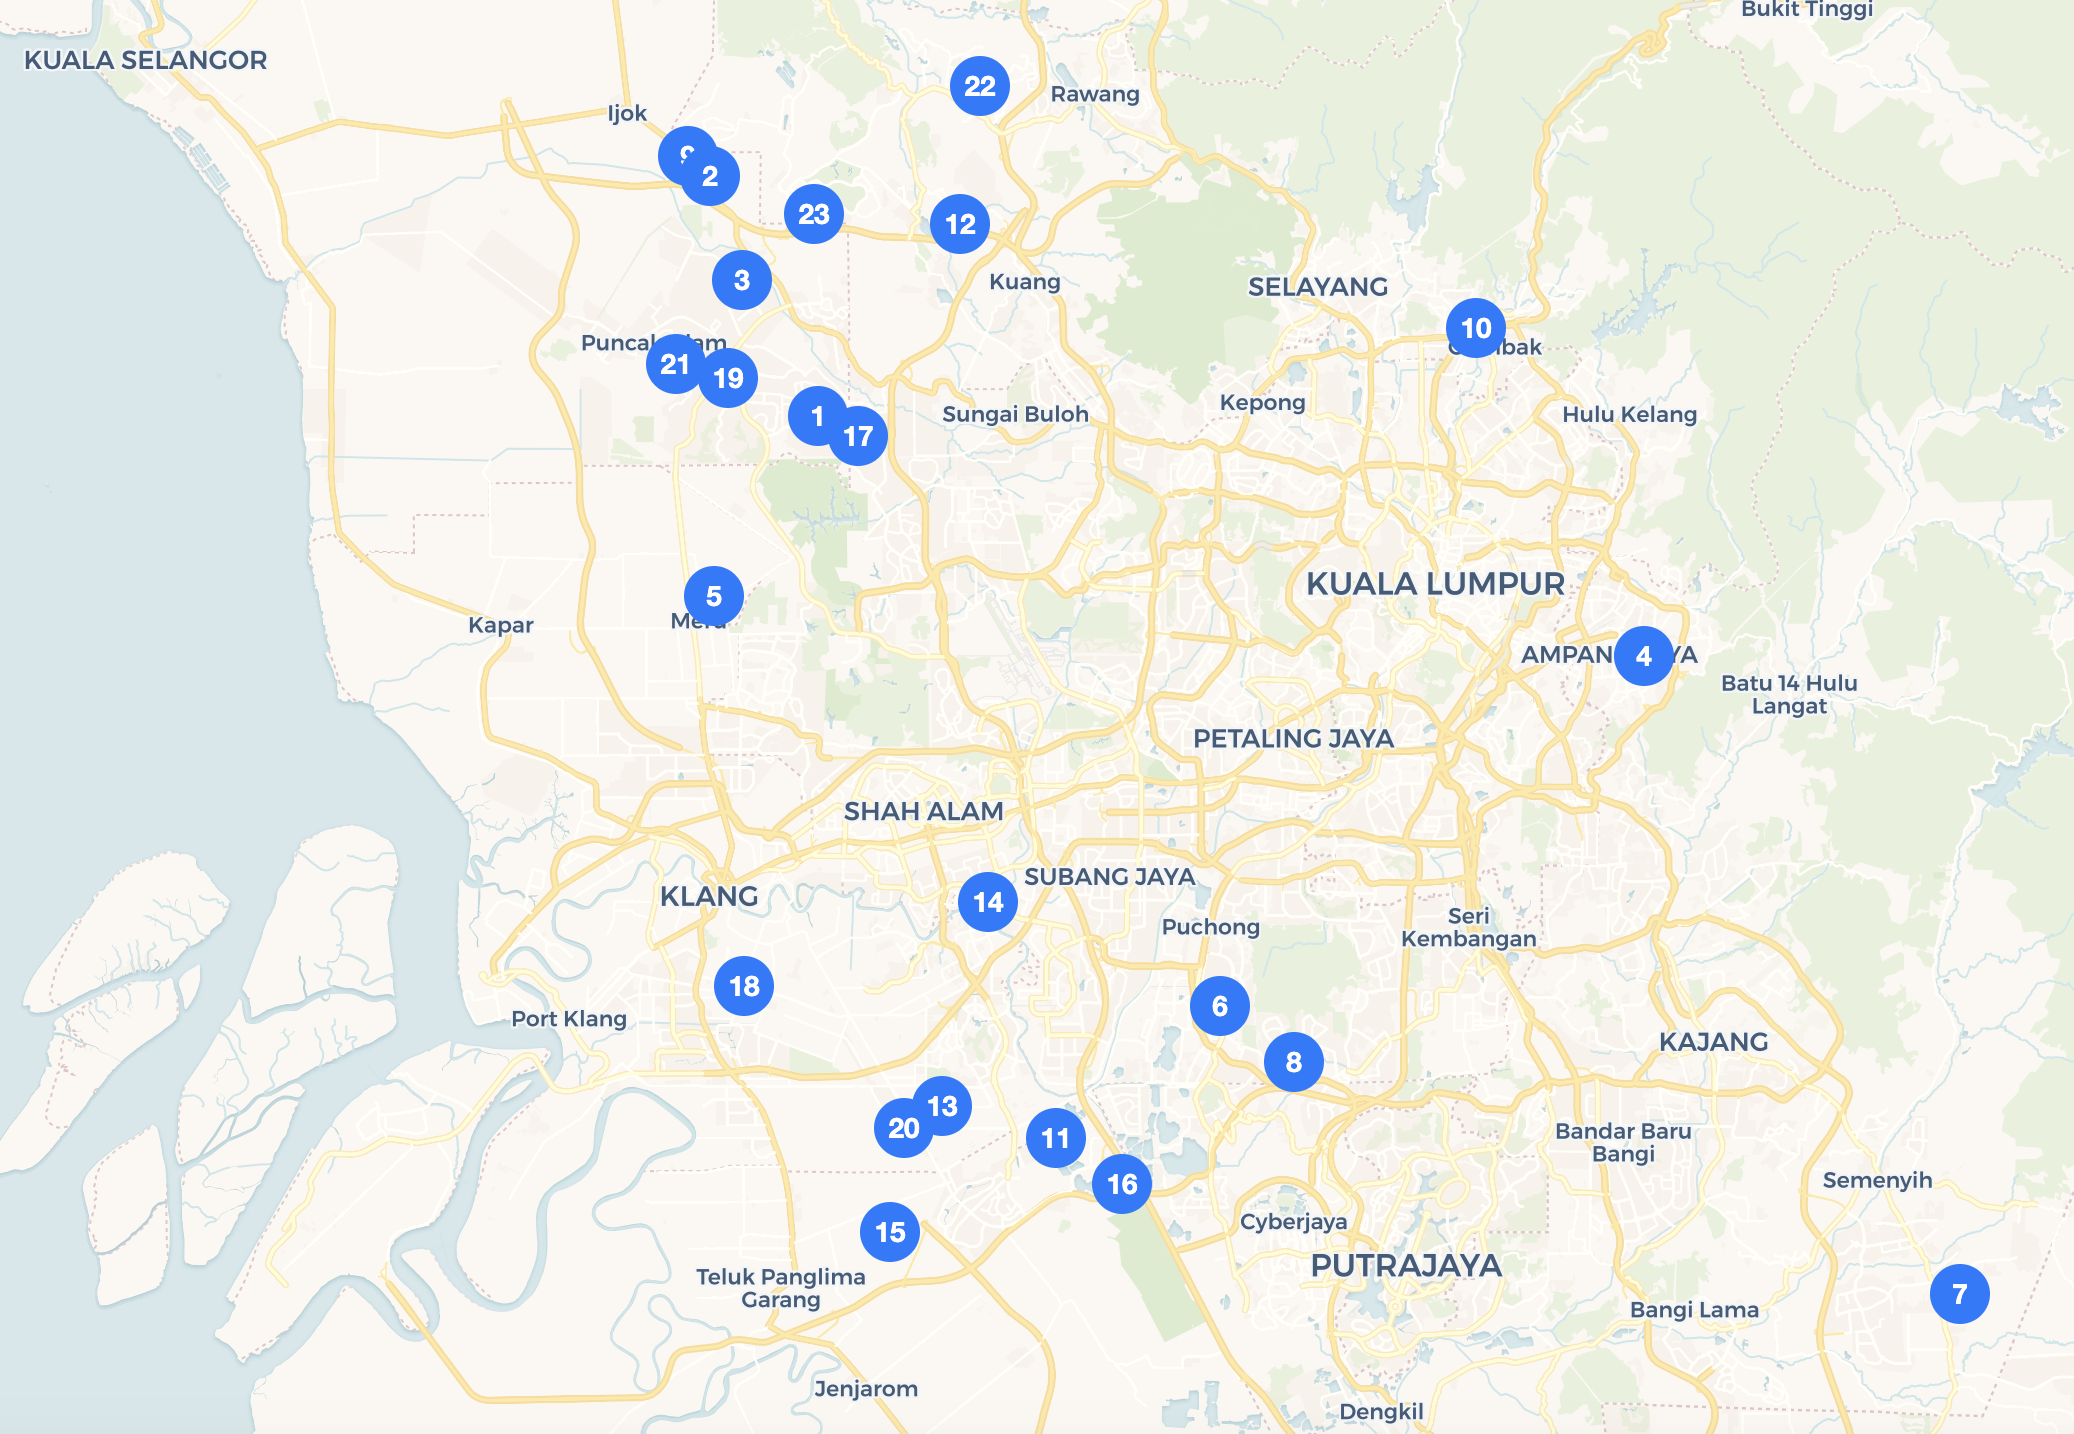
Group B - RM 600k to RM 800k
| # | Location | Number of Transactions | Total Value (RM - Million | Average Unit Price |
|---|---|---|---|---|
| 1 | BANDAR SETIA ALAM | 1660 | 1322 | RM796,438 |
| 2 | TAMAN RIMBAYU | 668 | 518 | RM775,422 |
| 3 | USJ 3 | 263 | 204 | RM775,310 |
| 4 | SERENE HEIGHTS | 301 | 232 | RM770,434 |
| 5 | SERENIA CITY | 727 | 559 | RM768,829 |
| 6 | BDR BUKIT RAJA | 1788 | 1372 | RM767,067 |
| 7 | BDR PUCHONG JAYA | 470 | 354 | RM752,507 |
| 8 | BDR DAMAI PERDANA | 326 | 242 | RM743,129 |
| 9 | USJ 2 | 207 | 153 | RM737,853 |
| 10 | BDR BOTANIC, KLANG | 503 | 368 | RM732,488 |
| 11 | BDR BUKIT TINGGI | 433 | 316 | RM728,729 |
| 12 | KOTA BAYUEMAS | 432 | 312 | RM722,903 |
| 13 | HAPPY GARDEN | 194 | 136 | RM701,579 |
| 14 | ECO GRANDEUR | 305 | 213 | RM697,274 |
| 15 | SEK. 7 SHAH ALAM | 230 | 157 | RM682,876 |
| 16 | TAMAN MELAWATI | 236 | 157 | RM667,359 |
| 17 | M ARUNA | 311 | 207 | RM664,903 |
| 18 | TAMAN PUTRA | 231 | 154 | RM664,721 |
| 19 | BDR MAHKOTA CHERAS | 593 | 391 | RM659,156 |
| 20 | BANDAR BARU SRI PETALING | 329 | 217 | RM658,489 |
| 21 | KEPONG BARU | 247 | 162 | RM657,392 |
| 22 | KOTA EMERALD | 398 | 258 | RM648,679 |
| 23 | BANGI AVENUE | 233 | 148 | RM635,396 |
| 24 | BDR PUTERI, KLANG | 384 | 240 | RM625,017 |
| 25 | TMN PUCHONG UTAMA | 321 | 197 | RM612,161 |
| 26 | BDR SG LONG | 337 | 203 | RM603,443 |
| 27 | TAMAN PUNCAK JALIL | 510 | 307 | RM602,525 |
| 28 | SETIA ECOHILL | 760 | 456 | RM600,416 |
- Table information based on selective NAPIC data from 2019 - 2023
- In the first half of Group B, Bandar Bukit Raja (#6) recorded the highest number of transactions and highest total value.
- In the second half of Group B, Setia Ecohill (#28) recorded the highest number of transactions and highest total value.


Map: © OpenStreetMap contributors | Basemap: © Carto | Powered by Leaflet
- Group B is more dispersed compared to Group A, with smaller clusters observed.
- Most areas are located on the southern side of Kuala Lumpur and extend toward Klang.
Group C - RM 400k to RM 600k
| # | Location | Number of Transactions | Total Value (RM - Million) | Average Unit Price |
|---|---|---|---|---|
| 1 | SAUJANA PERDANA | 570 | 338 | RM593,832 |
| 2 | CALEDONIA | 214 | 125 | RM584,309 |
| 3 | DAUNAN WORLDWIDE @ ALAM PERDANA | 339 | 190 | RM561,657 |
| 4 | TMN PANDAN INDAH | 202 | 106 | RM523,856 |
| 5 | TMN DESA BUKIT NILAM | 276 | 137 | RM494,843 |
| 6 | TAMAN LESTARI PUCHONG | 411 | 202 | RM491,233 |
| 7 | BDR TASIK KESUMA | 644 | 314 | RM487,126 |
| 8 | TAMAN SAUJANA PUCHONG | 214 | 103 | RM479,267 |
| 9 | KOTA PUTERI BANDAR BARU BT ARANG | 330 | 151 | RM456,178 |
| 10 | TAMAN SRI GOMBAK | 534 | 242 | RM453,526 |
| 11 | SEKSYEN 29, SHAH ALAM | 318 | 143 | RM449,437 |
| 12 | SCIENTEX KUNDANG JAYA | 886 | 396 | RM446,496 |
| 13 | SEKSYEN 30, SHAH ALAM | 544 | 236 | RM433,031 |
| 14 | SEK. 19 SHAH ALAM | 199 | 86 | RM430,774 |
| 15 | TMN BENTARA | 597 | 256 | RM429,260 |
| 16 | BDR SAUJANA PUTRA | 565 | 241 | RM426,885 |
| 17 | TMN SAUJANA UTAMA | 208 | 88 | RM421,435 |
| 18 | TMN SRI ANDALAS | 219 | 91 | RM414,497 |
| 19 | LAMAN HARIS @ ECO GRANDEUR | 326 | 135 | RM413,077 |
| 20 | BANDAR PUTERA 2 | 717 | 295 | RM411,754 |
| 21 | PUNCAK ALAM | 740 | 299 | RM404,044 |
| 22 | BANDAR COUNTRY HOMES | 326 | 132 | RM403,786 |
| 23 | BANDAR TASIK PUTERI | 953 | 383 | RM401,548 |
- Table information based on selective NAPIC data from 2019 - 2023
- In the first half of Group C, Scientex Kundang Jaya (#12) recorded the highest number of transactions and highest total value.
- In the second half of Group C, Bandar Tasik Puteri (#23) recorded the highest number of transactions and total value.

Map: © OpenStreetMap contributors | Basemap: © Carto | Powered by Leaflet
- Group C is more compact compared to Group B, with two main clusters observed, both extending further from the city center in the northwest and southwest directions.
Group D - RM 180k to RM 400k
| # | Location | Number of Transactions | Total Value (RM - Million) | Average Unit Price |
|---|---|---|---|---|
| 1 | TMN SUNGAI KAPAR INDAH | 244 | 95 | RM391,340 |
| 2 | TMN KLANG UTAMA | 294 | 114 | RM386,151 |
| 3 | TMN DATO' HORMAT, TPG | 225 | 86 | RM380,556 |
| 4 | TAMAN LANGAT UTAMA 3 | 305 | 114 | RM374,066 |
| 5 | TMN SENTOSA, KLANG | 1052 | 378 | RM358,977 |
| 6 | BDR MAHKOTA BANTING (BROOKLANDS) | 578 | 207 | RM358,420 |
| 7 | BDR RINCING | 282 | 96 | RM340,407 |
| 8 | TMN SRI MUDA, SEK. 25 SHAH ALAM | 398 | 135 | RM339,561 |
| 9 | PULAU INDAH | 286 | 93 | RM324,800 |
| 10 | BDR SULTAN SULEIMAN | 332 | 105 | RM314,977 |
| 11 | TAMAN BUNGA RAYA | 387 | 118 | RM304,794 |
| 12 | ALAM PERDANA, IJOK | 254 | 74 | RM292,878 |
| 13 | SELANGORKU PPAM @ULU YAM | 259 | 70 | RM270,088 |
| 14 | BANDAR SUNGAI BUAYA | 315 | 83 | RM264,507 |
| 15 | BANDAR BUKIT BERUNTUNG | 905 | 236 | RM261,160 |
| 16 | BUKIT SENTOSA | 1359 | 334 | RM245,935 |
| 17 | BANDAR UTAMA BATANG KALI | 353 | 74 | RM208,371 |
| 18 | TMN SUNGAI YU INDAH | 200 | 36 | RM182,125 |
- Table information based on selective NAPIC data from 2019 - 2023
- In the first half of Group D, Taman Sentosa, Klang (#5) recorded the highest number of transactions and overall total transaction value.
- In the second half of Group D, Bukit Sentosa, Hulu Selangor (#16) recorded the highest number of transactions and overall total transaction value.
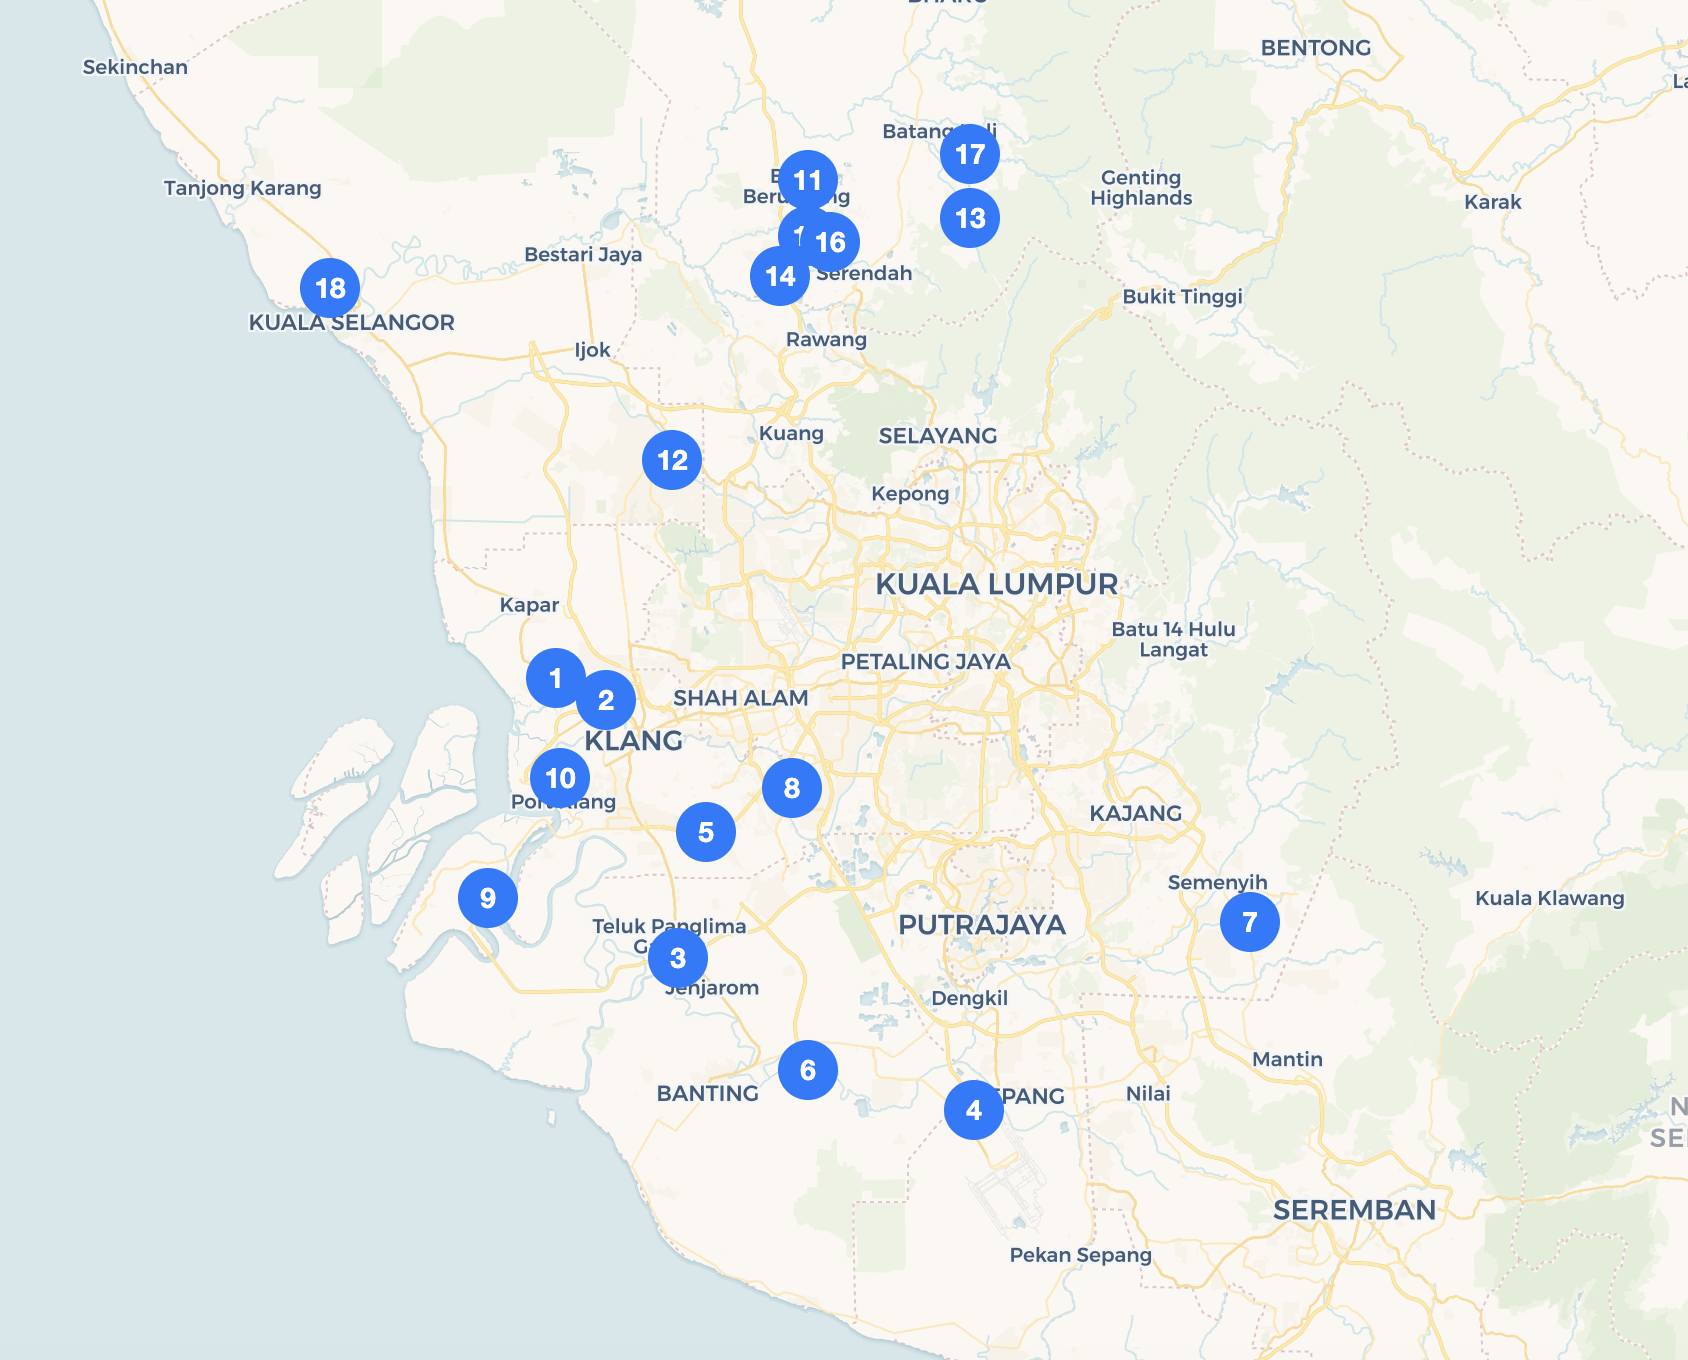

Map: © OpenStreetMap contributors | Basemap: © Carto | Powered by Leaflet
- Group D shows two main clusters: one in the northern region and the other extending toward Klang.
- At this price range, most areas with high transaction counts are located on the outskirts of the Klang Valley.
Disclaimer:
This document, created by City Valuers & Consultants, is intended for general informational purposes only and does not establish any advisory, fiduciary, or professional relationship. While based on established methods, it is not a definitive forecast, appraisal, or valuation, and we make no warranties or representations as to the data's current accuracy or completeness. The data presented includes third-party information, which could contain inaccuracies or be outdated, and has not been independently verified. We disclaim liability for any errors, omissions, or inaccuracies and any loss or damage arising from reliance on this information.